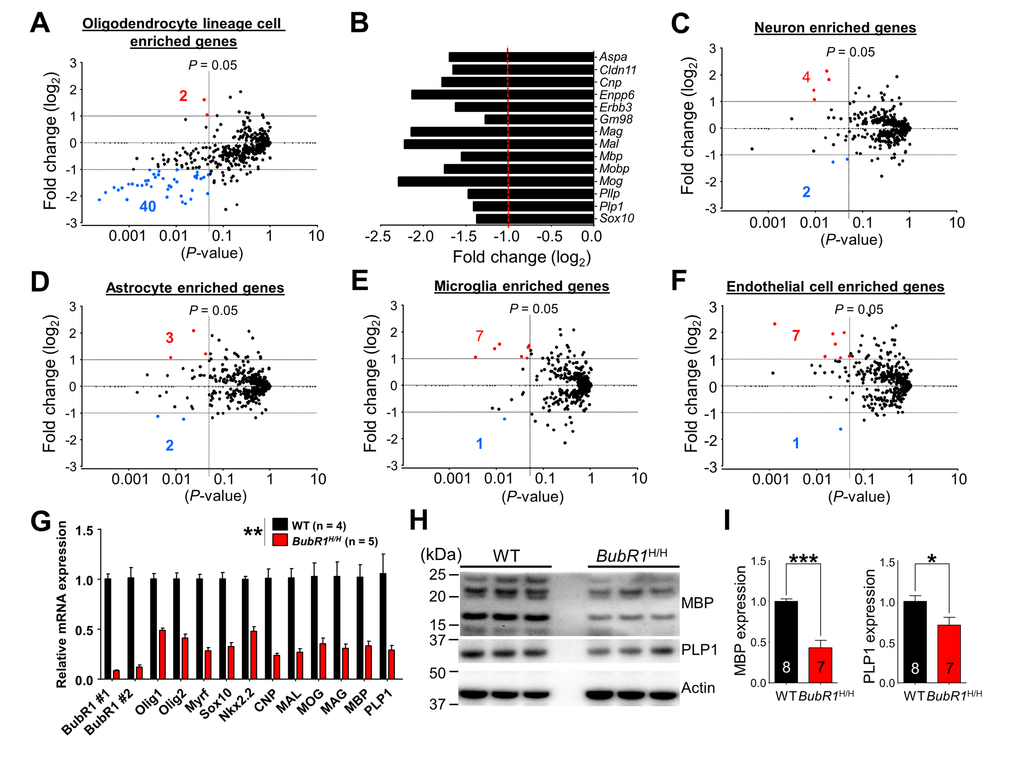
Figure 5.RNA-sequencing analysis reveals reduced expression of oligodendrocyte enriched genes in BubR1 insufficient mice. (A-F) Scatter plots for visualizing the top 500 genes expressed in each neural cell type, as determined by published RNA-seq data [30], in 8-week-old BubR1H/H mice relative to WT. Axes denote fold change (log2) by P-value. Vertical lines indicate P-value of 0.05, horizontal lines fold change (log2) of ±1. Red dots and corresponding number indicate up-regulated genes, blue dots and corresponding number indicate down-regulated genes. (A) Oligodendrocyte lineage cells enriched genes (2 up, 40 down). (B) Graph depicting a representative subset of oligodendrocyte- and myelination-related genes depicted in (A). Fold change represents BubR1H/H mice with WT as control. (C) Neuron enriched genes (4 up, 2 down). (D) Astrocyte enriched genes (3 up, 2 down). (E) Microglia enriched genes (7 up, 1 down). (F) Endothelial cell enriched genes (7 up, 1 down). Number of mice are 3 for each group. (G) Validation of mRNA expression of selected genes related to oligodendrocyte development and myelination. mRNA expression of oligodendrocyte development and myelination-related genes were significantly reduced in BubR1H/H mice. (H,I) Reduced expression of myelin-related proteins in BubR1 insufficient spinal cord. (H) Representative Western blot images of MBP and PLP1 in spinal cord lysates from 8-week-old WT and BubR1H/H mice. (I) Summary of densitometry quantification for MBP (16 and 21 kDa) and PLP1 (30 kDa) protein levels, which was normalized to that of actin for loading controls. All values represent mean ± SEM (*P < 0.05, **P < 0.01, ***P < 0.001, student’s t-test). Number associated with bar graphs indicates number of animals examined.
Figure 5 — The progeroid gene BubR1 regulates axon myelination and motor function | Aging