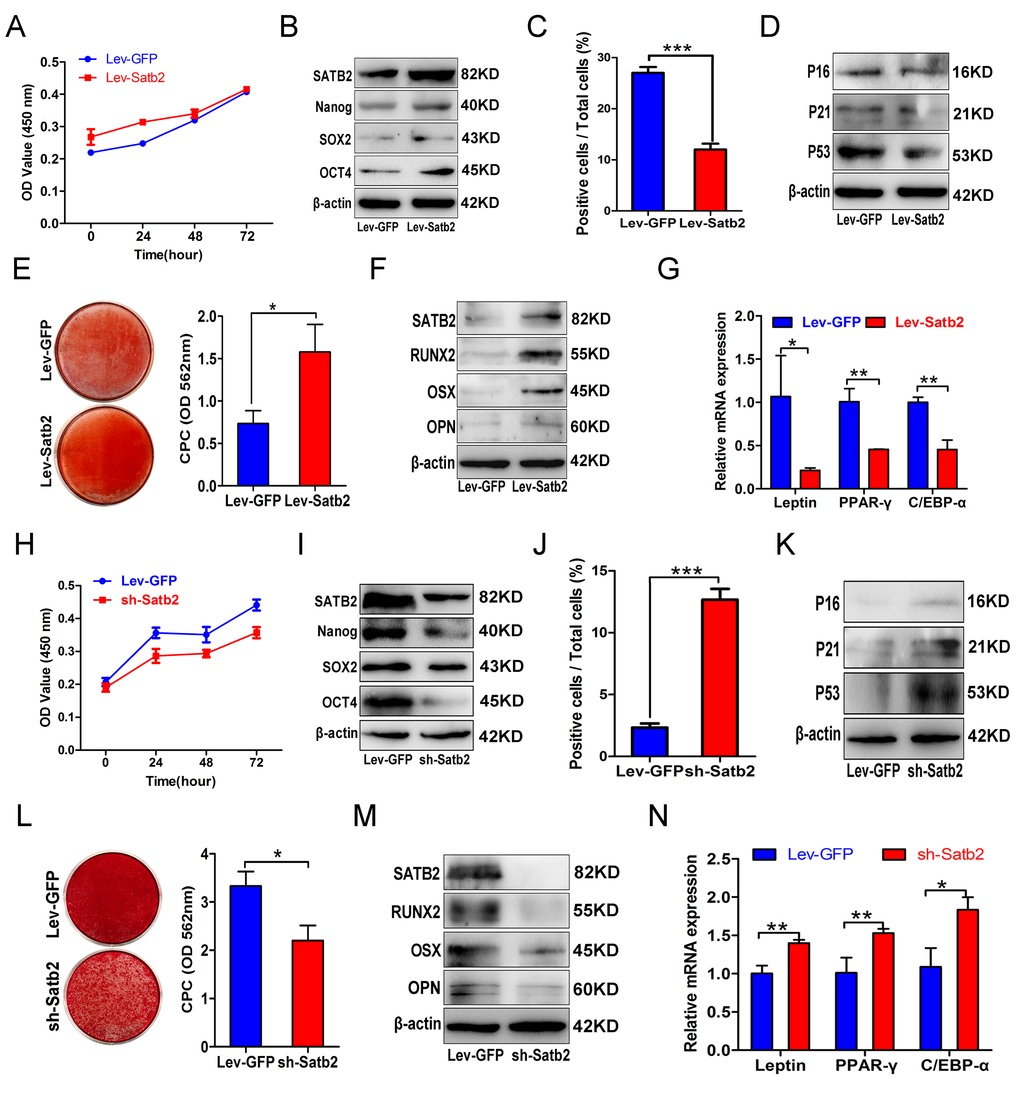
Figure 3.Gain and loss of function in SATB2 related to the properties of AB-BMSCs. (A) Ectopic SATB2 overexpression in AB-BMSCs from O group had no significant influence on cell proliferation. (B) Upregulated SATB2, Nanog, SOX2 and OCT4 expression was observed in BMSCs transfected with SABT2 overexpression lentivirus. (C) SATB2 overexpression on AB-BMSCs from O group decreased the number of SA-β-Gal positive cells and downregulated P16, P21 and P53 expression as compared with cells infected with empty vector. (D, E, F) SATB2 overexpression on AB-BMSCs from O group enhanced osteogenic differentiation as demonstrated by stronger Alizarin red staining and higher SATB2, RUNX2, OSX and OPN expression as compared with control cells at day 14 after osteogenic induction. (G) The mRNA levels of adipogenic markers Leptin, PPAR-γ and C/EBP-α were decreased in SATB2 overexpression in AB-BMSCs from O group as compared with control cells at day 14 after adipogenic induction. (H) SATB2 knockdown in AB-BMSCs from Y group inhibited cell proliferation. (I) Downregulated SATB2, Nanog, SOX2 and OCT4 expression was detected upon endogenous SATB2 silencing. (J, K) Increased SA-β-Gal positive cell and upregulated P16, P21 and P53 expression were observed in SATB2 knockdown cells. (L, M) SATB2 knockdown in AB-BMSCs from Y group exhibited lower osteogenic differentiation as shown by weaker Alizarin red staining and lower SATB2, RUNX2, OSX and OPN expression as compared with control cells at day 14 after osteogenic induction. (N) The mRNA levels of adipogenic markers Leptin, PPAR-γ and C/EBP-α were increased in SATB2 knockdown in AB-BMSCs from Y group as compared with control cells at day 14 after adipogenic induction. *p< 0.05, **p < 0.01, ***p < 0.001. Scale bar = 100 μm.