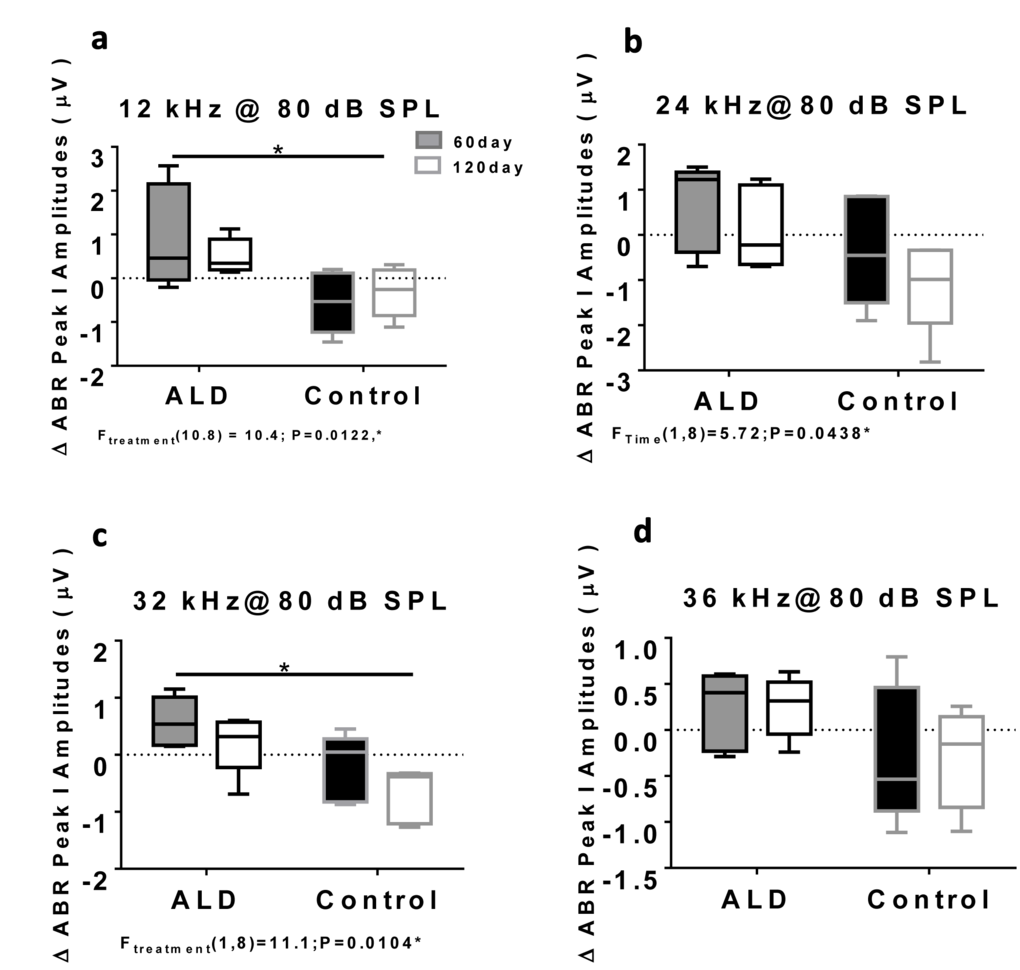
Figure 3.ABR Peak 1 amplitude changes (µV) at 80 dB SPL, for treated and untreated (control) subject groups, following 60 and 120 days of treatment. 12 kHz (a), 24 kHz (b), 32 kHz (c) and 36 kHz (d). Box plots (median, 1st & 3rd quartiles, whiskers: minimum & maximum) of frequency-specific ABR P1 amplitude changes in the treatment group (n = 5) on days 60 and 120 compared to the control group (n=5) values, showed improved hearing, i.e., increased ABR amplitudes, for all four test frequencies, with the greater benefits at the higher intensities. “0” on the ordinate represents the baseline (pre-treatment) ABR amplitude levels. So, positive shifts represent increased excitatory drive with time in the ALD treatment group, while negative shifts indicate age-related ABR level decreases in the control group. ANOVA: *p<0.05; error bars are SEM.