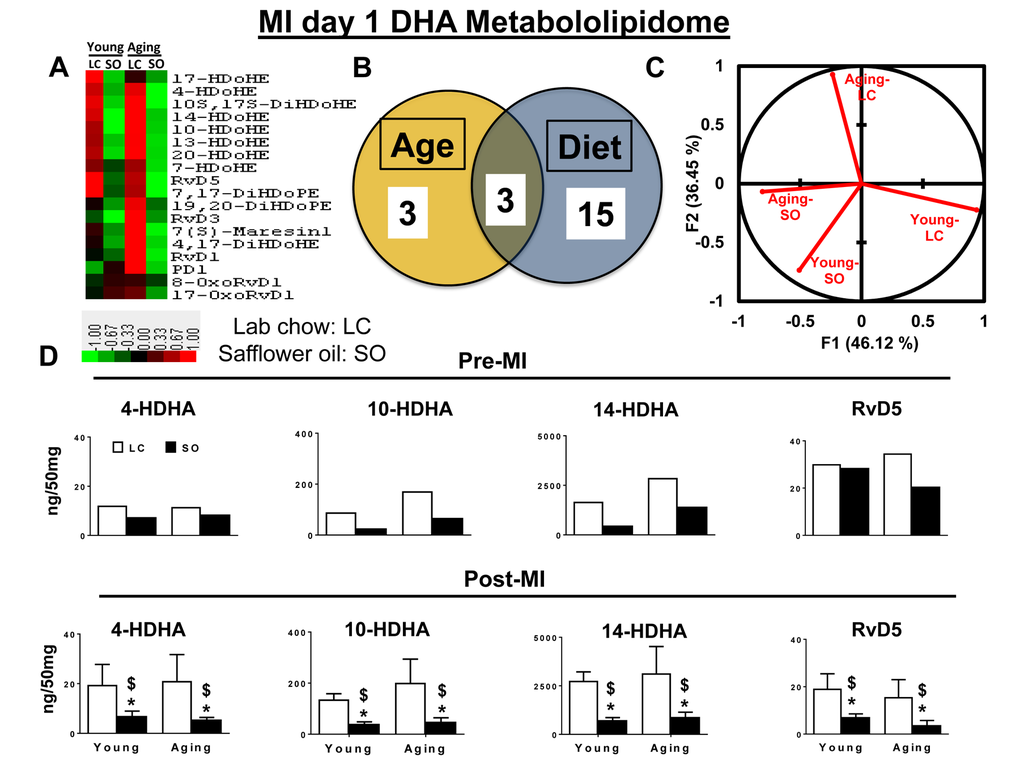
Figure 4.Excess omega-6 fatty acids dysregulate DHA metabololipidomics profile post-MI. (A) Hierarchal cluster analysis of change in DHA metabolites in young and aging, with and without SO diet. Color code bar representing change in expression from green (-1 lowest decrease) to red (+1 highest increase). (B) Venn diagram representing the number of DHA metabolites affected due to age (young and aging) and SO diet post-MI. (C) PCA analysis of DHA metabolites with respect to age and diet post-MI. (D) Bar graph representing change in DHA metabolite production at pre-MI (No-MI controls) and d1 post-MI.