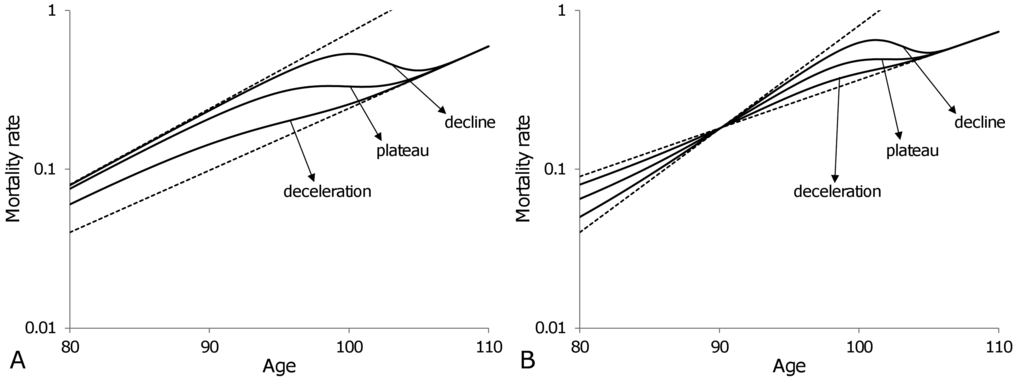
Figure 5.Theoretical trajectories (solid curves) of old-age (80-110) mortality dynamics for a heterogeneous population composed of two subpopulations. Variations in relative sizes of the subpopulations permit the reproduction of all three observations for late-life mortality: deceleration, plateau and decline. Once the individuals of the frailest subpopulation die out, the mortality of the entire population follows the exponential dynamics of the most robust subpopulation. In panel (A) the same subpopulation remains frailest over all ages, while in panel (B) the subpopulation which is frailest before age 90 becomes the most robust after age 90. Note that the plots are shown on a semi-logarithmic scale.