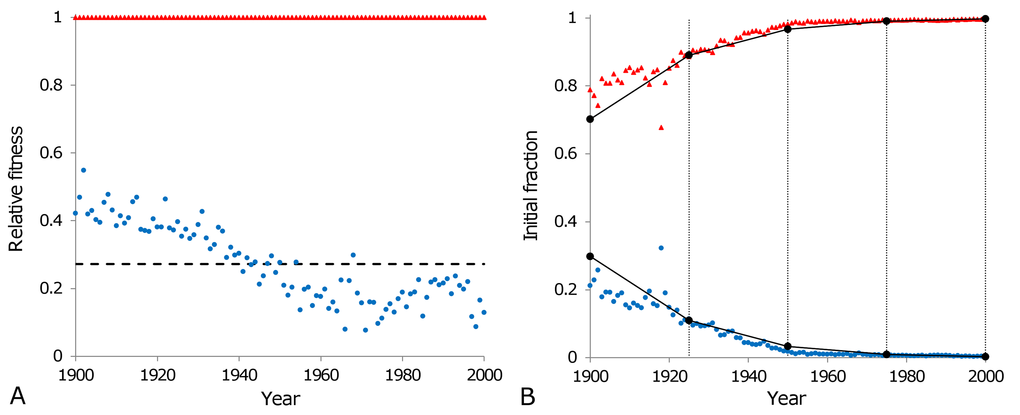
Figure 7.Population homogenisation as a consequence of natural selection. The relative fitnesses of individuals belonging to the third (blue circles) and the fourth (red triangles) subpopulations, as calculated according to the formulas in Table 3, are shown in panel (A). The relative fitness of the third subpopulation varies from year to year with an average value of 0.27 (black dashed line) over the entire century. This average value is used to calculate the changes in genotype frequencies due to natural selection as shown in panel (B) (black circles), over four generations (each lasting 25 calendar years as indicated by the vertical lines in panel (B). Calculated genotype frequencies are interpolated linearly (solid lines connecting circles in panel (B) within each generation to be comparable with the normalised initial fractions of the third (blue circles) and the fourth (red triangles) subpopulations modeled to fit the Swedish data for the period 1900 to 2000.