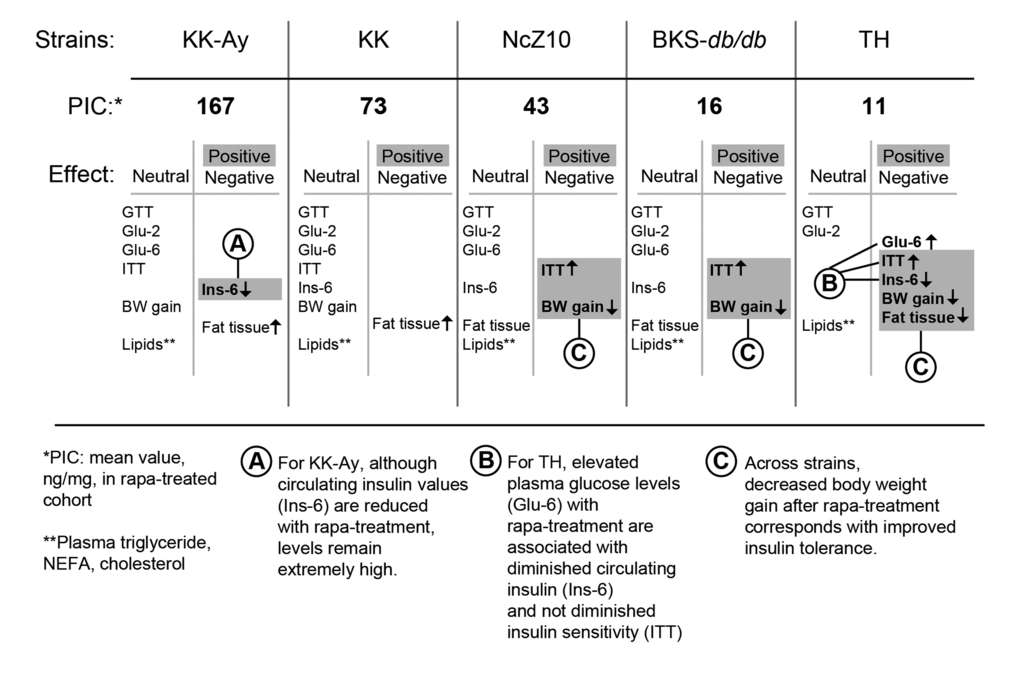
Figure 3.Phenotypic response pattern to rapamycin treatment scales inversely with PIC. The balance of positive and negative responses to rapamycin may be shaped by strain differences that control the pancreatic insulin content (PIC) response to rapamycin. The progress of diabetes within the first 6 weeks of treatment is relatively unaffected in strains that retain a relatively high PIC. With intermediate PIC levels, benefits appear that are associated with diminished gain in body weight, including diminished insulin resistance. At the lowest PIC level, glycemic management is impaired and hypoinsulinemic hyperglycemia emerges. *PIC: pancreatic insulin content (ng/mg) after rapa-treatment. **Lipids: plasma triglycerides, NEFA, cholesterol. Terms: GTT = glucose tolerance test; Glu-2 = non-fasting plasma glucose after 2 weeks of treatment; Glu-6 = non-fasting plasma glucose after 6 weeks of treatment; ITT = insulin tolerance test; Ins-6 = non-fasting plasma insulin after 6 weeks of treatment; BW = body weight.