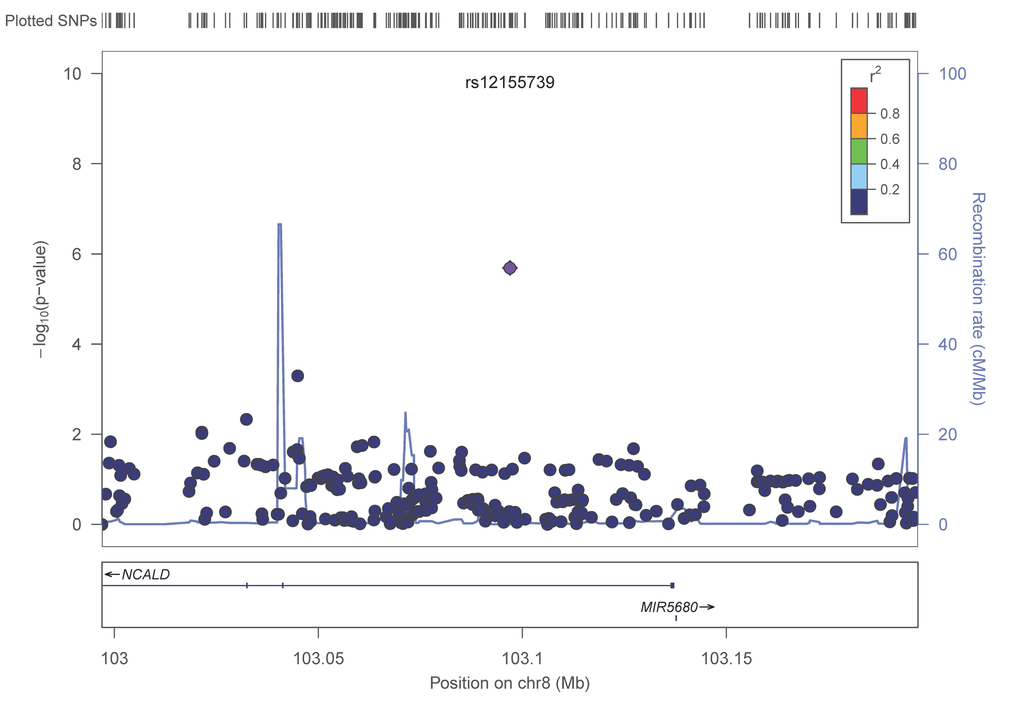
Figure 2E.LocusZoom plots for the suggested top 10 SNPs (5 genes) associated with gait speed of the combined analysis. (A) POM121L2; (B) HLA-DPB1, (C) UQCC2 (MNF1), (D) SASH1, (E) NCALD. In each plot, the −log10 of p values are on the left y-axis; the SNP genomic position (HG19) on the x-axis; the estimated recombination rate from 1000 genomes Nov. 2014 EUR are on the right y-axis and plotted in blue. The most significant SNP is in purple diamond and plotted using the p value attained from the meta-analysis. SNPs are colored to reflect linkage disequilibrium (LD) with the most significant SNP in red (pairwise r2 from 1000 genomes Nov. 2014 EUR). Gene annotations are from the SeattleSeqAnnotation141.