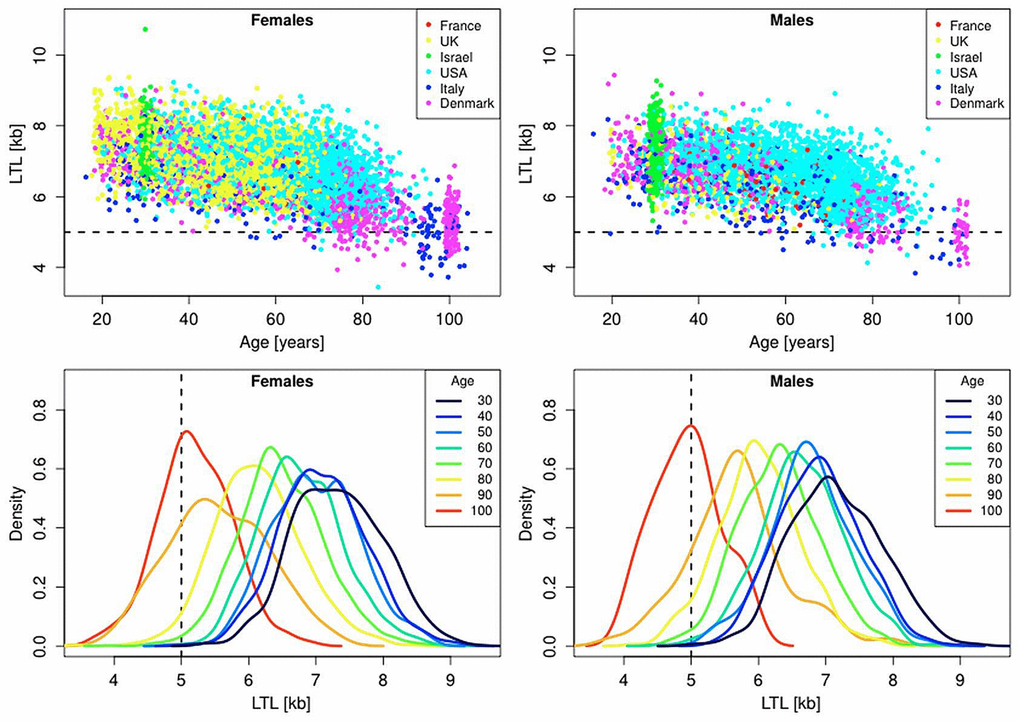
Figure 1.Scatter plots and density plots of LTL as a function of age for males and females residing in different countries. Measurements of LTL were performed in the same laboratory on DNA donated by participants in different studies in different countries (Supplemental Table 1). The horizontal dashed lines in the top panels and vertical dashed lines in the bottom panels indicate LTL values of 5 kb. The bottom plots are smoothed histograms obtained by kernel density estimation.