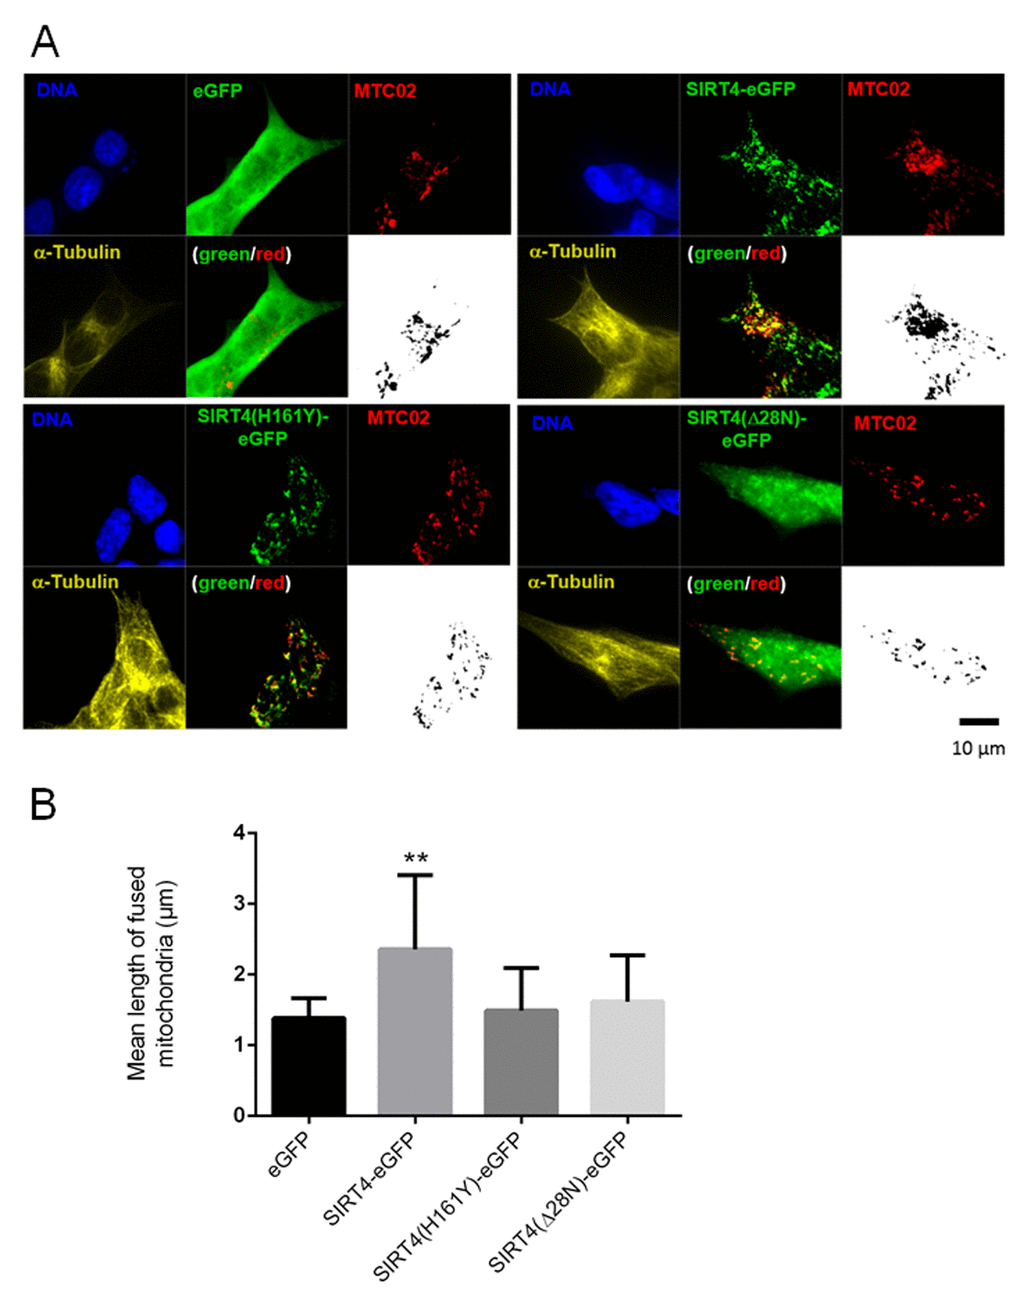
Figure 5.SIRT4-eGFP expression leads to increased mitochondrial aggregation/fusion. (A) Subcellular visualization of the mitochondrial marker MTC02 and α-Tubulin was performed by confocal microscopy in HEK293 cells stably expressing eGFP, SIRT4-eGFP, SIRT4(H161Y)-eGFP, or SIRT4(Δ28N)-eGFP. Mitochondrial profiles (MTC02; black/white pictures) were visualized using ImageJ software (Material & Methods and suppl. Material & Methods) to integrate microscopic confocal pictures. Cellular morphology/size was defined by α-Tubulin staining. Representative images are depicted. (B) Quantification of the mean length of fused mitochondria in cells expressing SIRT4-eGFP or its mutants. Numbers of cells analyzed from four experiments: eGFP, 136; SIRT4-eGFP, 75; SIRT4(H161Y)-eGFP, 104; SIRT4(Δ28N)-eGFP, 107. To evaluate statistical significance (compared to eGFP), two-way ANOVA followed-up by Tukey’s test was performed (**p<0.01)