


Introduction
Aging is defined as a time-dependent loss of physiological integrity and organ function and is characterized by key hallmarks, among them genomic instability, stem cell exhaustion, mitochondrial dysfunction, and cellular senescence [1]. Senescence is either elicited endogenously, e.g. via telomere shortening in the case of replicative senescence [2-4], or triggered by extrinsic noxae such as UV radiation (stress-induced senescence) that is responsible for photo-aging of the skin [5-7]. Senescent cells occur and accumulate in-vivo, and clearance of senescent cells ameliorates aging-associated pathologies thereby extending healthy lifespan [8,9]. The hallmarks of aging are functionally interconnected. For instance, upregulation of the cyclin-dependent kinase (CDK) and cell cycle inhibitor p21WAF, a p53 target gene and key effector of stress-induced cellular senescence [10,11], leads to a reduced capacity of stem cell dependent tissue regeneration [12]. Moreover, p21WAF maintains a vicious circle in γ-irradiated fibroblasts by re-enforcing senescence signaling via the generation of more mitochondrial reactive oxygen species (mtROS) and thus more ROS induced DNA damage [13]. Overall, the pro-aging effects of senescence and the SASP (senescence associated secretory phenotype) seem to be at least in part dependent on the presence of mitochondria [14,15].
The morphology and dynamics of mitochondria underlie a stringent quality control via fusion-fission cycles which are primarily mediated by the key large GTPases OPA1 (optic atrophy 1), mitofusins (MFN1 and 2), and DRP1 (dynamin-related protein 1). Aging-associated changes in the expression levels of fusion proteins (OPA1, MFN1/2) or reduction of the fission factors DRP1 and FIS1 (a recruitment factor for DRP1 in the mitochondrial outer membrane) have been observed in senescent endothelial or mesenchymal stem cells, both resulting in increased mitochondrial elongation and fusion [16,17]. As part of mitochondrial quality control, dysfunctional/depolarized, fragmented mitochondria are continuously eliminated by mitophagy, a form of selective autophagy [18-20]. However, there is accumulating evidence for a decline of autophagy and mitophagy during aging [18,21-27] thereby impairing mitochondrial quality and function. For instance, mitophagy was greatly reduced in aged muscle stem cells (satellite cells) resulting in accumulation of dysfunctional mitochondria, increased ROS generation, and a senescent phenotype [28,29].
Mitochondrial sirtuins (mtSIRT) comprise three members, SIRT3, SIRT4, and SIRT5 which are all involved in regulating energy metabolism and metabolic homeostasis [30-33] and whose expression is regulated by transcriptional and post-transcriptional mechanisms, including miRNAs [34,35]. Among the mtSIRTs, SIRT4 expression is upregulated during senescence triggered by different stimuli as well as in-vivo in photo-aged human skin [35]. Upregulation of SIRT4 expression can per se induce senescence as shown in trophoblast stem cells [36]. Only limited information exists about the role of mtSIRTs in the regulation of mitochondrial morphology/dynamics and quality control mechanisms. SIRT3, the major deacetylase of metabolic targets in mitochondria, promotes mitochondrial networking and function by activating the fusion factor OPA1 [37]. In the case of SIRT5, an enzyme with demalonylase, deglutarylase, and desuccinylase activities [38,39] that regulates ammonia detoxification, mitochondrial size was increased and mitophagy decreased upon SIRT5 overexpression [40]. Lastly, overexpression of SIRT4 was linked to the regulation of mitochondrial dynamics via inhibition of ERK-mediated phosphorylation of the pro-fission factor DRP1, therefore inhibiting its activity and hence mitochondrial fission [41]. Similar to SIRT5, several enzymatic activities have been described for SIRT4, including ADP-ribosylation of glutamate dehydrogenase (GDH) [42], lipoamidase mediated targeting of the pyruvate dehydrogenase (PDH) complex [43], and lysine deacetylation in the control of leucine metabolism [44].
We demonstrated recently that up-regulation of endogenous SIRT4 expression inhibits the mitochondrial membrane potential (ΔΨm), increases mtROS level, and alters mitochondrial morphology towards aggregation [35]. Here, we further addressed the molecular basis for this phenotype in cells stably expressing wild-type and mutant forms of SIRT4 at low levels and characterized the role of SIRT4 in mitochondrial morphology/quality control and mitophagy under basal and mitochondrial stress conditions.
Results
SIRT4 promotes stress induced mitochondrial ROS production
In the present study, we addressed the role of SIRT4, a miR-15b repressed and stress-inducible senescence-associated mitochondrial sirtuin [35,45], in the regulation of mitochondrial dynamics and quality control. We generated HEK293 cell lines stably expressing C-terminal eGFP fusion proteins of SIRT4, including its catalytically inactive version (H161Y) or SIRT4(Δ28N) lacking the N-terminal mitochondrial targeting signal [46]. Expression and subcellular localization of SIRT4-eGFP and its mutants were confirmed by confocal microscopy, immunoblotting, and flow cytometry analysis (Suppl. Fig. 1). We next subjected these cell lines to CCCP (Carbonylcyanide m-chlorophenylhydrazone) treatment and hence to dissipation of the mitochondrial membrane potential (ΔΨm). As depicted in Fig. 1, cells expressing SIRT4-eGFP displayed a significant increase in stress-induced mitochondrial ROS (mtROS) levels which were two-times higher as compared to eGFP-expressing control cells and which could be significantly inhibited by co-treatment with the mitochondria-specific anti-oxidant mitoQ [47,48]. In contrast, mtROS response was significantly weaker in cells expressing SIRT4(H161Y)-eGFP or SIRT4(Δ28N)-eGFP (Fig. 1). Here, co-treatment with mitoQ did not show an effect. Thus, consistent with the mtROS inducing and Ψm-decreasing role of SIRT4 in primary human dermal fibroblasts [35], SIRT4 expression promotes stress-induced mtROS production also in HEK293 cells via its enzymatic activity.
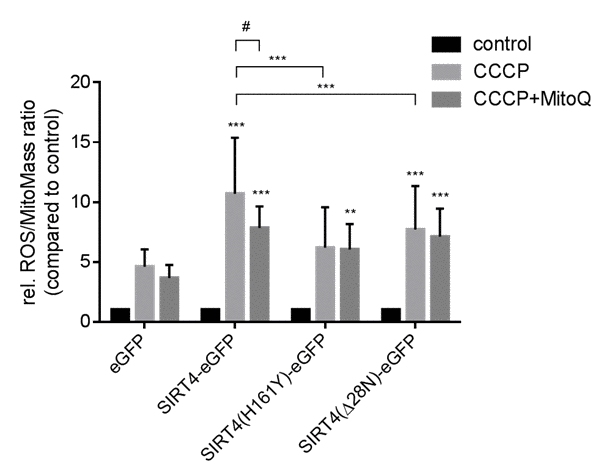
Figure 1. Catalytically active SIRT4-eGFP increases mitochondrial ROS production after CCCP-induced mitochondrial uncoupling. HEK293 cell lines stably expressing eGFP, SIRT4-eGFP, SIRT4(H161Y)-eGFP, or SIRT4(Δ28N)-eGFP were treated with CCCP (10 nM) for two hours either with or without pretreatment with MitoQ (100 nM; 16 hours). Thereafter cells were stained with the cell-permeant dyes MitoTracker® Deep Red and MitoSOX™ Red followed by flow cytometric analysis. Shown are mean ± s.d. values from nine experiments. To evaluate statistical significance (comparison of eGFP vs. wild-type or mutant SIRT4 or comparisons indicated by brackets) two-way ANOVA followed-up by Tukey’s test were performed (**p<0.01; ***p<0.001). The effect of MitoQ treatment was evaluated using a paired t-test (#p<0.05).
SIRT4 expression promotes stress triggered autophagic flux, but decreases Parkin associated mitophagy considering the increased mitochondrial content
Mitochondria with sustained depolarization are removed by mitophagy, a selective degradation mechanism for damaged mitochondria, ensuring mitochondrial quality control [22,49]. To assess the role of SIRT4 in this process we determined the autophagic flux in HEK293 cell lines stably expressing SIRT4-eGFP or its mutants by analyzing the levels of the autophagy marker LC3B-II after treatment with rapamycin (mTORC1 inhibitor and general autophagy inducer) or CCCP (a mitochondrial uncoupler and selective mitophagy inducer). As depicted in Fig. 2, LC3B-II levels were approximately two-fold-increased in CCCP-treated HEK293 SIRT4-eGFP cells, but did not change significantly in cells expressing SIRT4(H161Y)-eGFP or SIRT4(Δ28N)-eGFP. We did not detect significant changes in the autophagic flux of any of these cell lines following rapamycin treatment. Consistent with the immunoblot analysis in Fig. 2, the number of LC3B dots per cell was also approximately two-fold higher in CCCP treated SIRT4-eGFP cells vs. eGFP controls as determined by confocal imaging analysis (data not shown). Given this potentially specific effect of SIRT4 on mitophagy, we next analyzed the translocation of the E3 ligase Parkin to damaged mitochondria, a process that promotes selective recruitment of mitochondria to the autophagic machinery [18]. HEK293 cells expressing SIRT4-eGFP (or its mutants) were transfected with a cDNA coding for mCherry-Parkin, subjected to treatment with CCCP and Bafilomycin A1 (BafA1), and analyzed by confocal microscopic imaging (Fig. 3A). Translocation of mCherry-Parkin to mitochondria was observed in all instances as expected after dissipation of the membrane potential. Yet, only for SIRT4-eGFP expressing cells the mitochondrial mass was increased when compared to the eGFP control (Fig. 3B). Taking this into account, we observed that HEK293 cells expressing SIRT4-eGFP, but not the catalytically inactive SIRT4(H161Y)-eGFP or the extra-mitochondrially localized SIRT4(Δ28N)-eGFP mutants, displayed a relative decrease in mCherry-Parkin/MTC02 double-positive dots by approximately 40% when standardized against the mitochondrial content (i.e., total MTC02 signal) (Fig. 3C). Taken together, these data indicate that under mitochondrial stress conditions SIRT4 despite promoting mtROS production leads to a net decrease in mitophagy and therefore subsequent decreased removal of dysfunctional mitochondria.
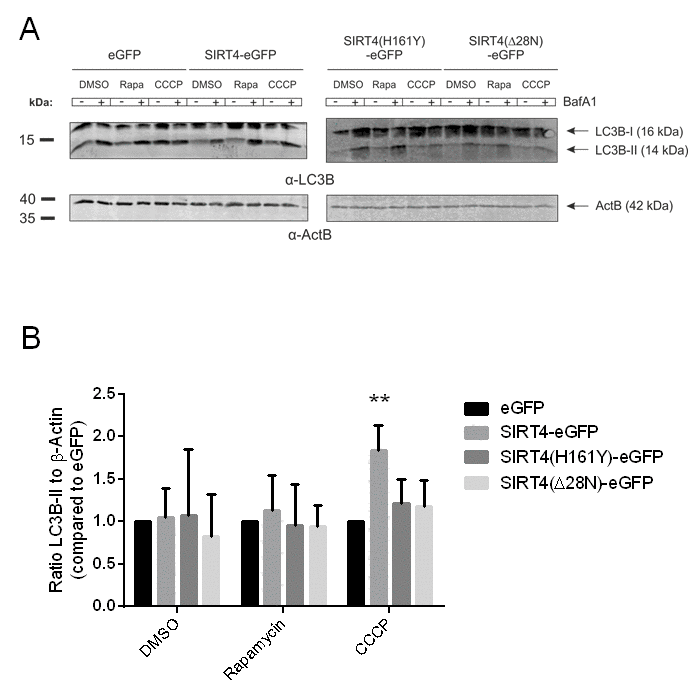
Figure 2. SIRT4-eGFP expression leads to an increased autophagic flux upon CCCP-induced mitochondrial uncoupling. (A) HEK293 cell lines stably expressing eGFP, SIRT4-eGFP, SIRT4(H161Y)-eGFP, or SIRT4(Δ28N)-eGFP were treated with DMSO (control), rapamycin (100 nM), or CCCP (10 µM) for two hours. In addition, during the second hour cells were either untreated (-) or co-treated (+) with BafA1 (Bafilomycin A; 100 nM) that stalls autophagic flux via inhibition of the fusion between lysosomes and autophagosomes. A representative experiment is depicted in which LC3B-I and LC3B-II levels were analyzed by immunoblotting. (B) LC3B-II signals (co-treatment with BafA1) were compared to the protein levels of β-Actin/ACTB as loading control using ImageJ based quantification. Data shown are mean ± s.d. values from four to seven experiments. To evaluate statistical significance (treatment vs. DMSO) two-way ANOVA followed by Tukey’s test was performed (**p<0.01).
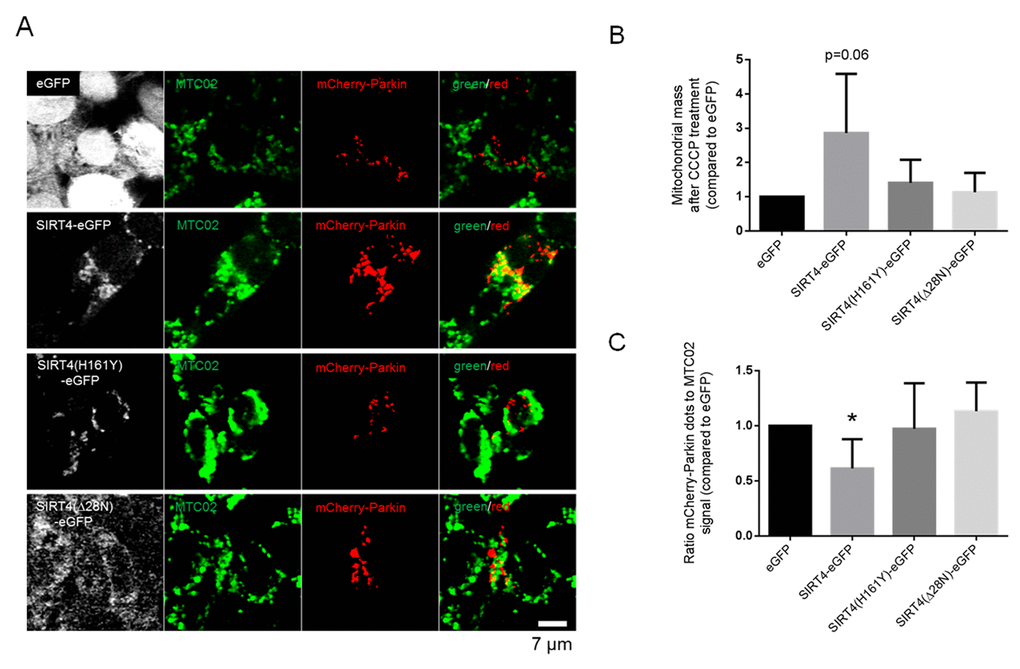
Figure 3. SIRT4-eGFP expression results in overall decreased mitochondrial recruitment of mCherry-Parkin upon CCCP-induced mitochondrial uncoupling. (A) HEK293 cell lines stably expressing eGFP, SIRT4-eGFP, SIRT4(H161Y)-eGFP, or SIRT4(Δ28N)-eGFP (GFP signal in white) were transfected with an expression construct for mCherry-Parkin (red). After one day, cells were treated with CCCP (10 µM) for two hours followed by co-treatment with BafA1 (100 nM) during the second hour. Cells were fixed and subjected to confocal microscopic analysis. Mitochondria were detected using the marker MTC02 (green). (B) Quantification of the mitochondrial content via MTC02 staining analysis using ImageJ software (Material & Methods and suppl. Material & Methods). (C) Quantification of mCherry-Parkin/MTC02 double-positive dots was performed based on the mitochondrial content as determined in (B) using ImageJ software (Material & Methods and suppl. Material & Methods). Numbers of cells analyzed in (B) and (C) from four experiments: eGFP, 57; SIRT4-eGFP, 55; SIRT4(H161Y)-eGFP, 43; SIRT4(Δ28N)-eGFP, 48. To evaluate statistical significance two-way ANOVA followed by Tukey’s test was performed (*p<0.05).
SIRT4 expression inhibits mitochondrial respiration already under basal conditions
The findings above raised the question whether ectopic SIRT4 expression predisposes cells to mitochondrial stress by impacting already on basal mitochondrial functions such as oxidative phosphorylation. Conflicting results have been described regarding the impact of increased SIRT4 levels on mitochondrial oxygen consumption [50,51]. We therefore measured the oxygen flow in HEK293 cells expressing SIRT4-eGFP (or its mutants) under basal conditions and upon inhibition of specific respiratory complexes of the electron transport chain (ETC) [52]. As depicted in Fig. 4A and B, HEK293 SIRT4-eGFP cells displayed a significantly reduced oxygen flow both under basal conditions and at maximum respiration, the latter mirroring a reduced electron transport system capacity (ETS) upon complete mitochondrial uncoupling of the electron transport system using CCCP. Surprisingly, cells expressing SIRT4(Δ28N)-eGFP, which cannot localize to mitochondria, showed a significantly increased O2 flow both at basal and maximum respiration (Fig. 4C). This finding suggests a dominant-negative function of SIRT4(Δ28N) that could be caused by inhibition and/or trapping of endogenous SIRT4 in the cytosol. This interpretation is consistent with an increased oxygen flux and improved mitochondrial function upon SIRT4 depletion [51].
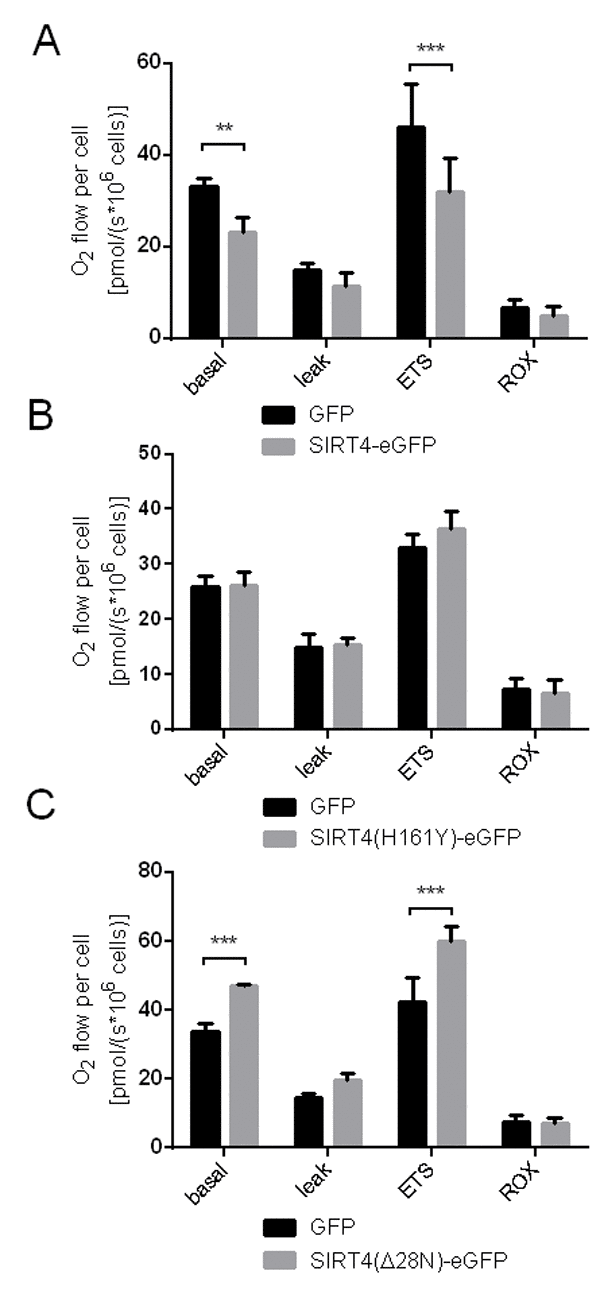
Figure 4. Oxygen consumption is reduced in HEK293 cells expressing SIRT4-eGFP. Respirometric measurements of oxygen consumption were performed in HEK293 cell lines stably expressing SIRT4-eGFP (A), SIRT4(H161Y)-eGFP (B), or SIRT4(Δ28N)-eGFP (C) as previously described [52,64]. Oxygen consumption was measured under basal and stressed conditions (leak: treatment with oligomycin A, 2 µg/ml; ETS: mitochondrial uncoupling of the electron transport system using CCCP, 400-500 nM; residual oxygen consumption, ROX: treatment with 500 nM rotenone and 2.5 µM antimycin A) as compared to control cells expressing eGFP. To evaluate statistical significance two-way ANOVA followed by Tukey’s test was performed [**p<0.01, ***p<0.001; SIRT4-eGFP: n=5; SIRT4(H161Y)-eGFP, n=4; SIRT4(Δ28N)-eGFP: n=4].
SIRT4 expression leads to a higher degree of elongated/fused mitochondria associated with higher levels of the mitochondrial fusion regulator L-OPA1
Mitochondria, dependent on their (dys)functional status/depolarization, undergo either increased mitochondrial fusion or fission, the latter of which leads to mitophagic clearance upon excessive damage [20,27]. To further analyze the impact of SIRT4 on mitochondrial quality control we analyzed the mitochondrial network, i.e. mass and structure, in HEK293 cells expressing SIRT4-eGFP (or its mutants). We employed confocal microscopy using staining with the anti-mitochondria antibody MTC02 and subsequent ImageJ based analysis. As depicted in Fig. 5A, cells expressing SIRT4-eGFP underwent an increased mitochondrial aggregation already under basal (untreated) conditions. This aggregation was clearly less pronounced in GFP control cells or cells expressing the SIRT4 mutants. These findings were corroborated by flow cytometry where HEK293 SIRT4-eGFP cells, but not cells expressing SIRT4(H161Y)-eGFP or SIRT4(Δ28N)-eGFP, depicted significantly increased MitoTracker® staining intensity and hence an increased mitochondrial mass (Suppl. Fig. 2A and 2B). Further quantitative analysis revealed that the mean length of fused mitochondrial tubes was significantly increased only in SIRT4-eGFP expressing cells (Fig. 5B and Suppl. Fig. 3; Suppl. Movie 1, 2, 3, 4). To corroborate this finding at the molecular level we analyzed the proteolytic processing of the large GTPase and key mitochondrial fusion/fission regulator OPA1 [53,54]. Indeed, in HEK293 SIRT4-eGFP cells, the ratio of the proteolytically processed forms of OPA1 was significantly shifted from S-OPA1 (associated with mitochondrial fission and mitophagy) towards L-OPA1 (associated with mitochondrial fusion) (Fig. 6A and 6B). Taken together, these data suggest that SIRT4-eGFP expression inhibits mitochondrial respiration that in terms of mitochondrial quality control translates into increased mitochondrial fusion, the latter possibly resulting in reduced basal mitophagy.
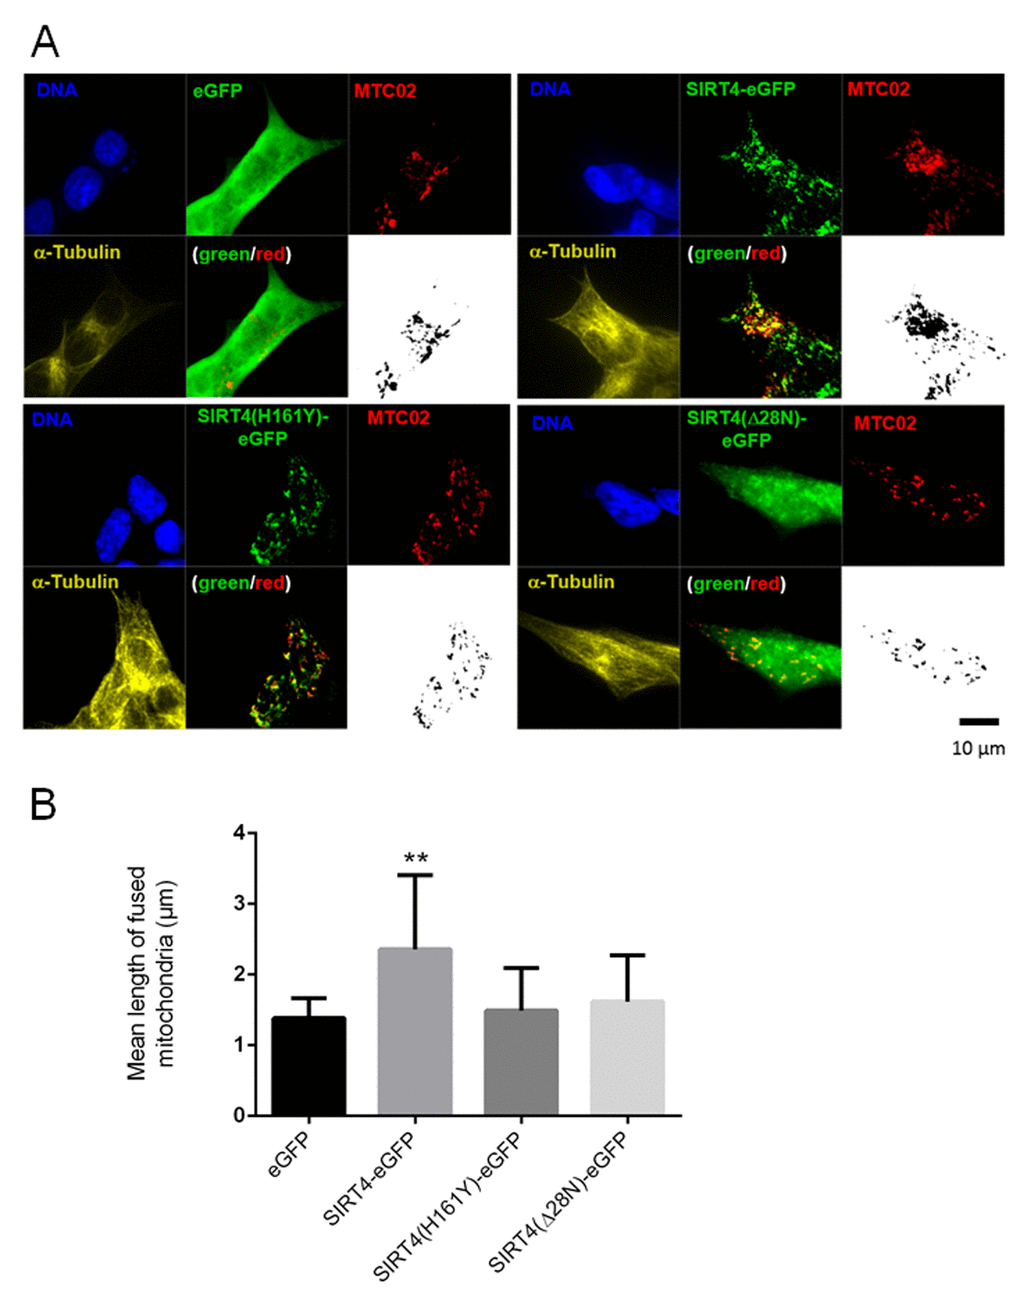
Figure 5. SIRT4-eGFP expression leads to increased mitochondrial aggregation/fusion. (A) Subcellular visualization of the mitochondrial marker MTC02 and α-Tubulin was performed by confocal microscopy in HEK293 cells stably expressing eGFP, SIRT4-eGFP, SIRT4(H161Y)-eGFP, or SIRT4(Δ28N)-eGFP. Mitochondrial profiles (MTC02; black/white pictures) were visualized using ImageJ software (Material & Methods and suppl. Material & Methods) to integrate microscopic confocal pictures. Cellular morphology/size was defined by α-Tubulin staining. Representative images are depicted. (B) Quantification of the mean length of fused mitochondria in cells expressing SIRT4-eGFP or its mutants. Numbers of cells analyzed from four experiments: eGFP, 136; SIRT4-eGFP, 75; SIRT4(H161Y)-eGFP, 104; SIRT4(Δ28N)-eGFP, 107. To evaluate statistical significance (compared to eGFP), two-way ANOVA followed-up by Tukey’s test was performed (**p<0.01)
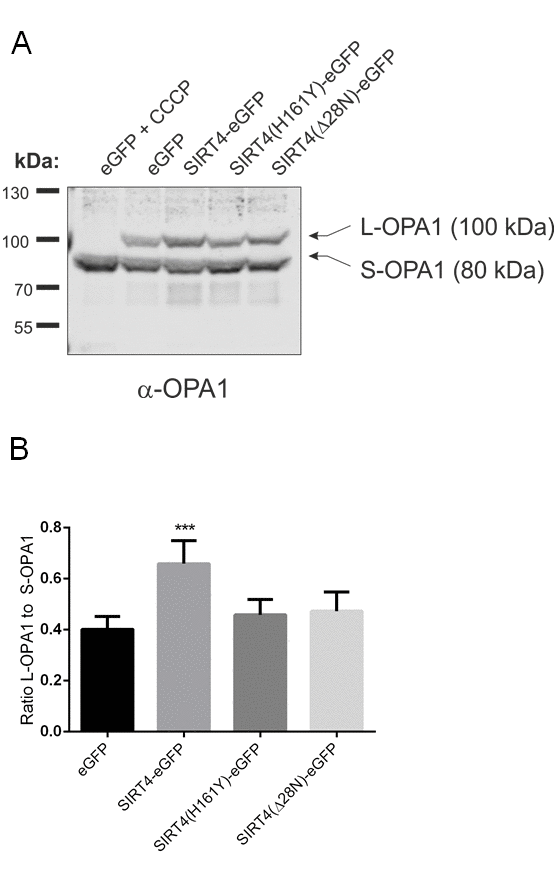
Figure 6. SIRT4-eGFP expression stabilizes the mitochondrial fusion regulator L-OPA1. (A) The expression of L-OPA1 vs. S-OPA1 was analyzed by immunoblotting in HEK293 cells stably expressing eGFP, SIRT4-eGFP, SIRT4(H161Y)-eGFP, or SIRT4(Δ28N)-eGFP. As a control for complete proteolytic processing of L-OPA1 to S-OPA1 eGFP-expressing control cells were treated with CCCP (10 µM) for two hours. (B) The ratio between the expression levels of L-OPA1 and S-OPA1 was determined by ImageJ-based densitometric analysis. To evaluate statistical significance (compared to eGFP), two-way ANOVA followed by Tukey’s tests was performed (**p<0.01; n=6).
SIRT4 interacts with the mitochondrial fusion regulator L-OPA1
To get further insight into the molecular mechanism of how SIRT4 regulates basal mitochondrial quality control we performed co-immunoprecipitation and mass spectrometry to identify interaction partners of SIRT4 in HEK293 cells. The mitochondrial fusion regulator OPA1 was identified to interact specifically with SIRT4-eGFP. Next, we verified this interaction by Western blot analysis after co-immunoprecipitation both in untreated and in CCCP-stressed cells using single-domain-anti-GFP antibodies (Fig. 7A). Here, both forms of OPA1, L-OPA1 and S-OPA1, co-immunoprecipitated with SIRT4-eGFP as well as with its mutants. However, we observed that the amount of L-OPA1 co-immunoprecipitating with SIRT4(H161Y)-eGFP was significantly lower as compared to wild-type SIRT4-eGFP when standardized to the total protein input (Fig. 7B). The (direct or indirect) interaction between SIRT4-eGFP and OPA1 could be confirmed via reverse co-immunoprecipitation using a rabbit anti-OPA1 antibody [55] (Suppl. Fig. 4). Taken together, SIRT4 may interact in an enzyme activity-dependent manner with L-OPA1 via a currently unknown mechanism and thereby regulate mitochondrial fusion.
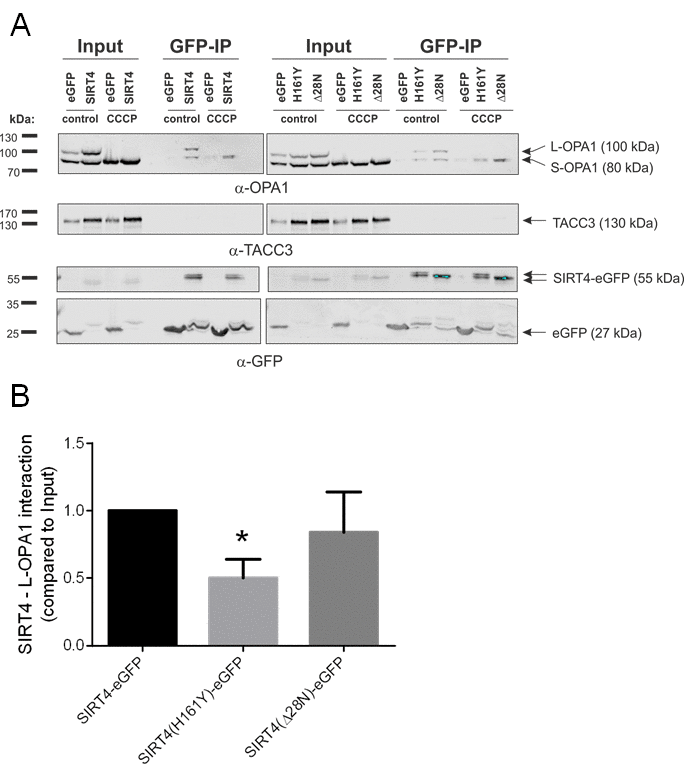
Figure 7. SIRT4-eGFP interacts with OPA1. (A) HEK293 cells stably expressing SIRT4-eGFP, SIRT4(H161Y)-eGFP, or SIRT4(Δ28N)-eGFP were either untreated or treated with CCCP (10 µM, 2h) and thereafter subjected to OPA1 co-immunoprecipitation (IP) analysis using sepharose beads coupled anti-GFP single-domain-antibodies (nanobodies). Total cell lysates were loaded as input control (5%). CCCP treatment caused a complete proteolytic processing of L-OPA1 to S-OPA1. TACC3 was detected using specific antibodies and served as a representative negative co-immunoprecipitation control. (B) SIRT4 enzymatic activity is required for efficient interaction of SIRT4 with L-OPA1. The amount of L-OPA1 co-immunoprecipitated with SIRT4-eGFP, SIRT4(H161Y)-eGFP, or SIRT4(Δ28N)-eGFP was determined in relation to the protein input and subjected to ImageJ-based densitometric analysis. To evaluate statistical significance, two-way ANOVA followed by Tukey’s tests was performed (*p<0.05; n=4).
Upregulation of endogenous SIRT4 expression in fibroblast models of cellular senescence increases L-OPA1 levels and mitochondrial fusion in a SIRT4- dependent manner
Altered mitochondrial dynamics with decreased autophagy or mitophagy are hallmarks to cellular aging [22-24,27,56]. We therefore expanded our analyses to primary human dermal fibroblasts to confirm the role of the SIRT4 – L-OPA1 axis in mitochondrial morphology and dynamics in a cellular model more relevant to aging. To upregulate the expression of SIRT4 fibroblasts were either transfected with miR-15b inhibitors or subjected to γ-irradiation (γIR; single dose of 20 Gy) [35]. Under both conditions fibroblasts showed an anti-proliferative response [13,35], as e.g. measured by decreased BrdU incorporation (Suppl. Fig. 5). Thereafter, L-OPA1 vs. S-OPA1 levels and the mitochondrial profile/morphology were analyzed in the presence or absence of siRNA duplexes against SIRT4. Consistent with the findings in SIRT4-eGFP expressing HEK293 cells, in both fibroblast senescence models the ratio of L-OPA1 to S-OPA1 was significantly up-regulated, both in a SIRT4-dependent manner (Fig. 8A and 8B) and consistent with corresponding changes in the mitochondrial profiles as visualized by confocal microscopy and quantitative ImageJ based analysis. Increased mitochondrial mass and significantly elevated mitochondrial fusion (indicated by an increased mean length of fused mitochondrial tubes) were observed upon SIRT4 upregulation through miR-15b inhibition (Fig. 9, Suppl. Fig. 6, Suppl. Movie 5, Suppl. Movie 6, Suppl. Movie 7) or γ-irradiation (Fig. 10, Suppl. Fig. 7, Suppl. Movie 8, 9, 10).
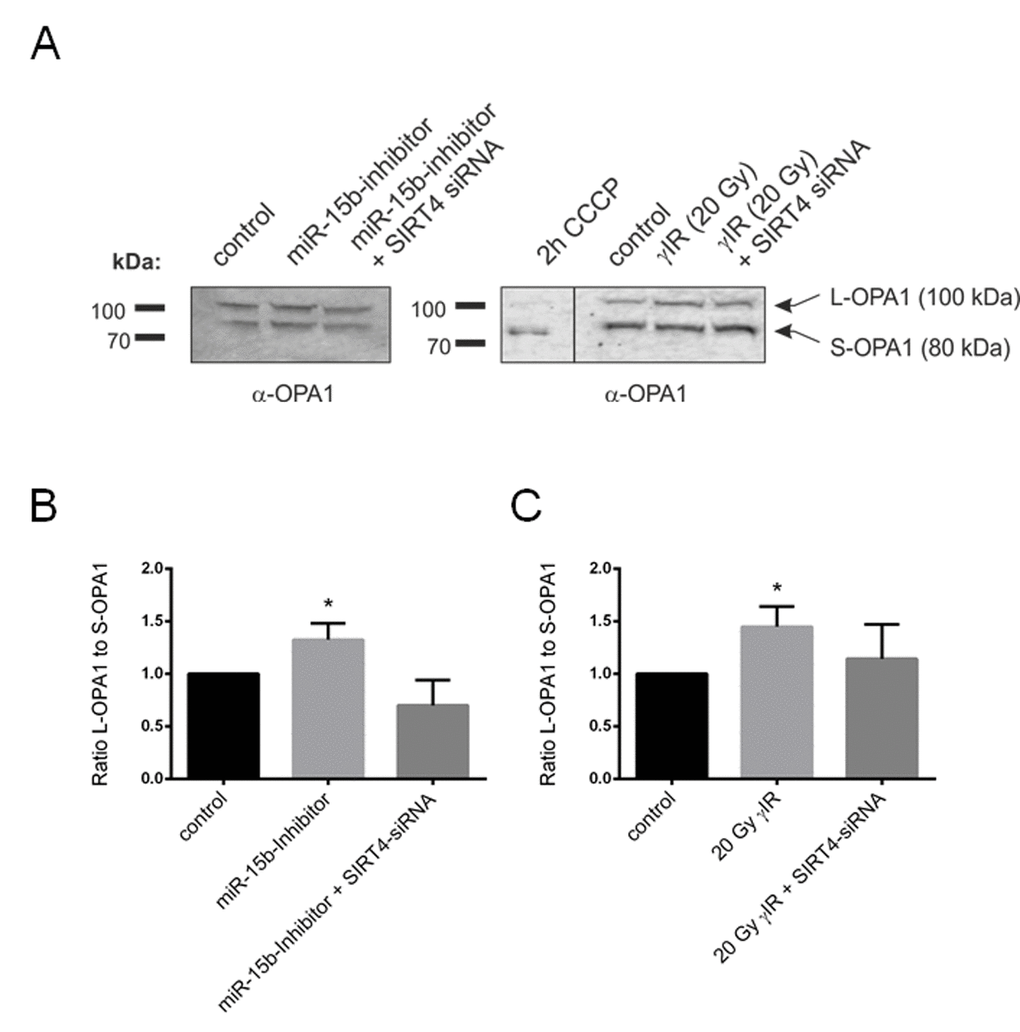
Figure 8. Aging-associated SIRT4 upregulation leads to a shifted L-OPA1 to S-OPA1 ratio in two different fibroblast senescence models. Primary human dermal fibroblasts were either transfected with miR-15b inhibitors (or control oligonucleotides) or subjected to γ−irradiation (γIR; 20 Gy) (both in the presence or absence of siRNA duplexes against SIRT4) [35] followed by analysis of OPA1-L and OPA1-S expression by immunoblotting after four days (A) As a control for complete proteolytic processing of L-OPA1 to S-OPA1, fibroblasts were treated with CCCP (10 µM) for two hours. The ratio between the expression levels of L-OPA1 and S-OPA1 was determined by ImageJ-based densitometric analysis in miR-15b inhibitor transfected fibroblasts (B) and cells subjected to γIR (C). To evaluate statistical significance (compared to control), two-way ANOVA followed by Tukey’s test was performed (*p<0.05; n=4).
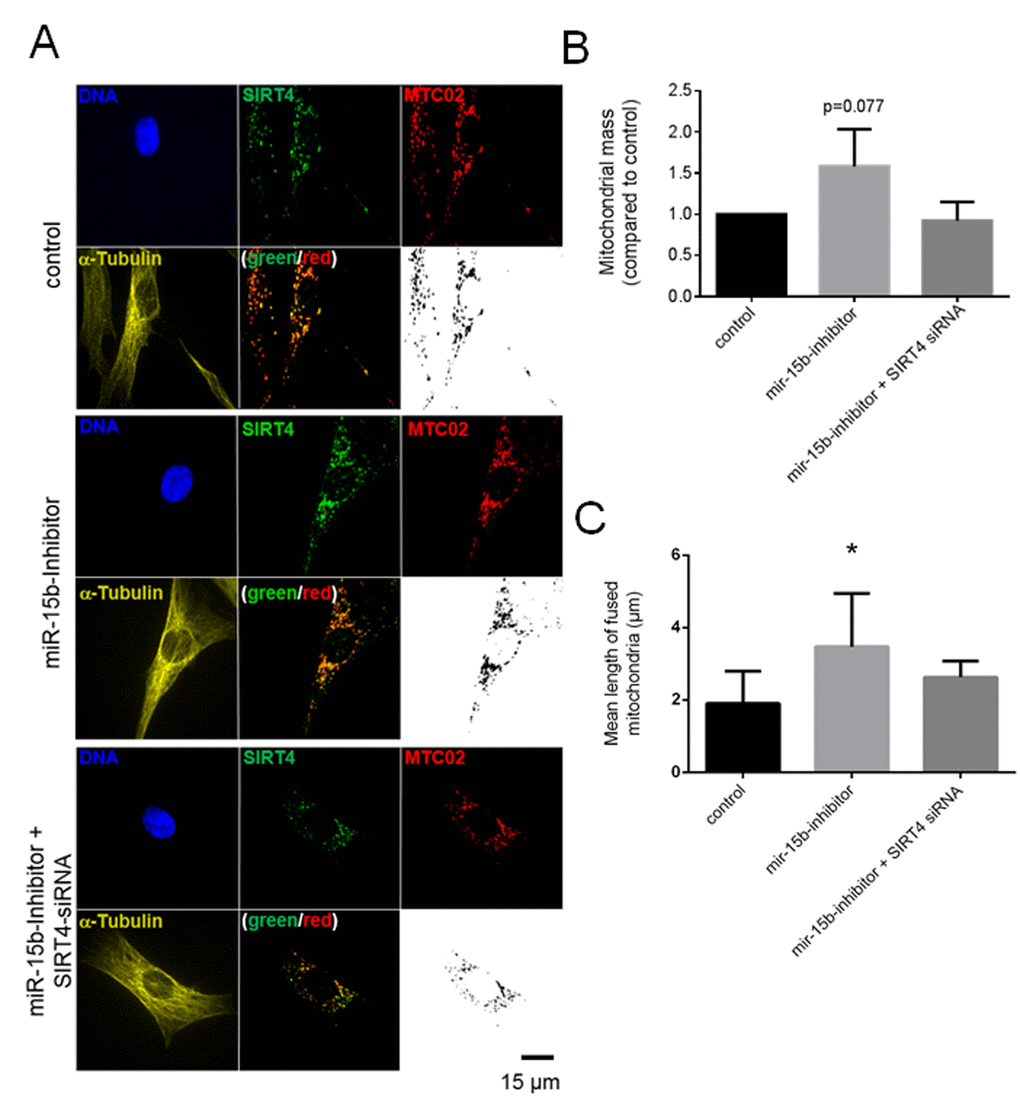
Figure 9. SIRT4 upregulation through miR-15b inhibition increases L-OPA1 levels and promotes mitochondrial fusion in fibroblasts. (A) Primary human dermal fibroblasts were transfected with miR-15b inhibitors (or control oligonucleotides) in the presence or absence of siRNA duplexes against SIRT4 [35] followed by subcellular visualization of SIRT4 (green), MTC02 (red), and α-Tubulin (yellow) after four days. The mitochondrial profiles (MTC02; black/white) were further visualized as binary confocal pictures. Cellular morphology/size was defined by α-Tubulin staining. Representative images are depicted. (B) Quantification of the mitochondrial mass via MTC02 staining analysis using ImageJ software (Material & Methods and suppl. Material & Methods). (C) Quantitative analysis of mitochondrial fusion/length of mitochondrial tubes (as exemplified in Suppl. Fig. 6) using ImageJ software (Material & Methods and suppl. Material & Methods). To evaluate statistical significance, two-way ANOVA followed by Tukey’s test was performed (*p<0.05; n=12-14 cells analysed by spinning disk confocal microscopy in three experiments).
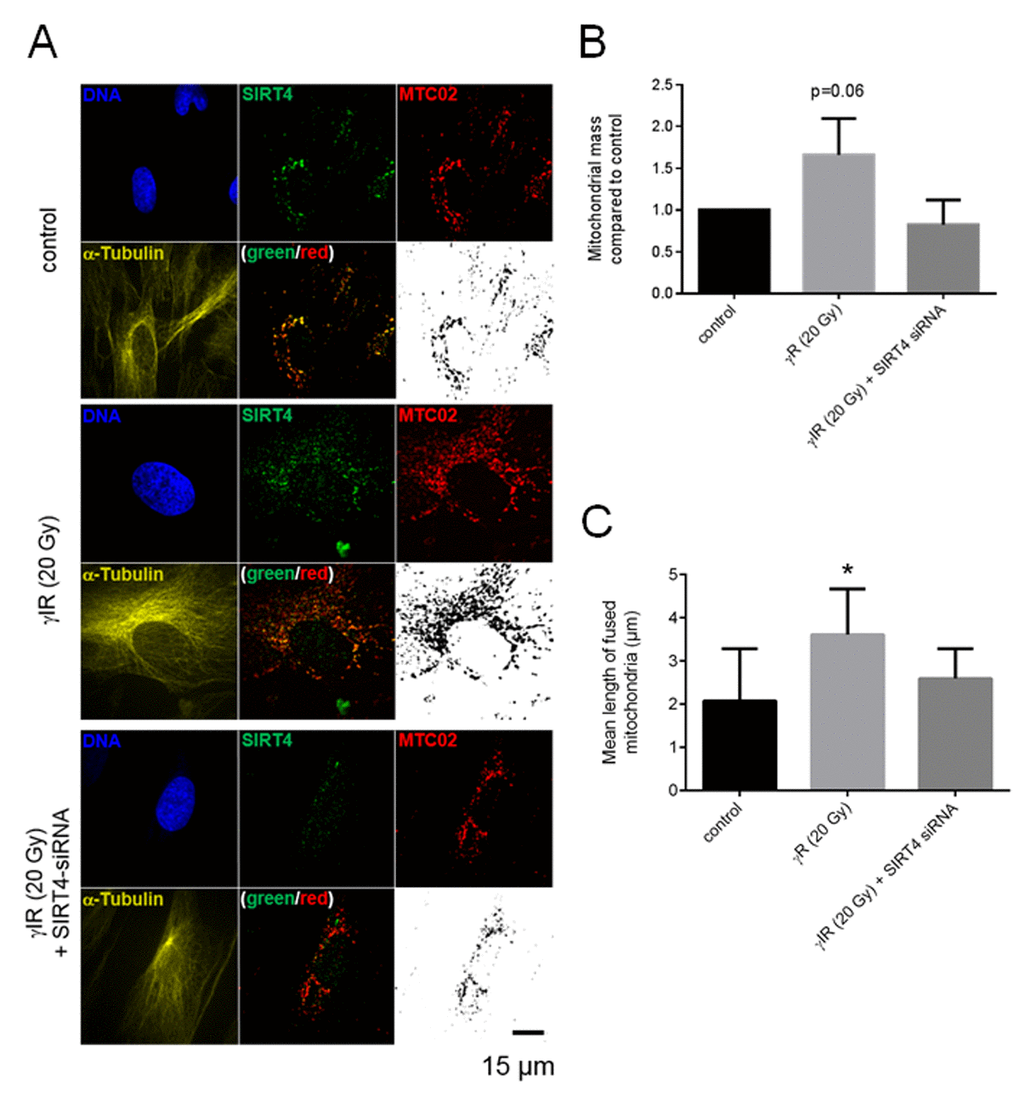
Figure 10. SIRT4 upregulation upon ionizing radiation stress increases L-OPA1 levels and promotes mitochondrial fusion in fibroblasts. (A) Primary human dermal fibroblasts were subjected to γIR (20 Gy) both in either the presence or absence of siRNA duplexes against SIRT4 [35] followed by subcellular visualization of SIRT4 (green), MTC02 (red), and α-Tubulin (yellow) after four days.The mitochondrial profiles (MTC02; black/white) were further visualized as binary confocal pictures. Cellular morphology/size was defined by α-Tubulin staining. Representative images are depicted. (B) Quantification of the mitochondrial mass via MTC02 staining analysis using ImageJ software (Material & Methods and suppl. Material & Methods). (C) Quantitative analysis of mitochondrial fusion/length of mitochondrial tubes (as exemplified in Suppl. Fig. 7) using ImageJ software (Material & Methods and suppl. Material & Methods). To evaluate statistical significance, two-way ANOVA followed by Tukey’s test was performed (*p<0.05; n=13-19 cells analysed by spinning disk confocal microscopy in three experiments).
Discussion
This study provides novel insight into the role of the mitochondrially localized and aging associated sirtuin SIRT4 in basal and stress-induced regulation of mitochondrial morphology and turnover mechanisms. Our data show that SIRT4 promotes mtROS generation triggered by dissipation of the membrane potential across the inner membrane. Although this led to an increase in autophagic flux, overall Parkin-linked mitophagy was apparently decreased due to an increased mitochondrial content. Mechanistically, we propose that SIRT4 functions via interacting with L-OPA1 representing a novel regulatory axis in mitochondrial quality control, i.e. promotion of mitochondrial fusion and therefore likely reduction of mitophagy (summarized in Fig. 11).
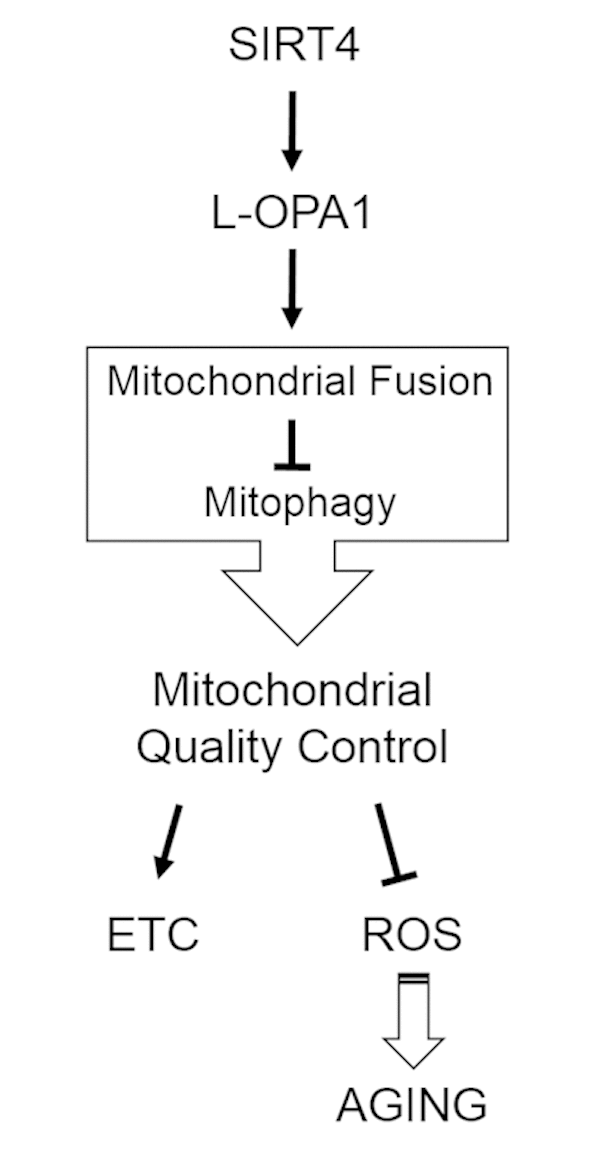
Figure 11. Model summarizing the regulatory role of the SIRT4-OPA1 axis in mitochondrial quality control. OPA1, optic atrophy gene 1; ETC, electron transport chain; ROS, reactive oxygen species.
Mitochondria represent a major source of ROS [57] that dependent on its concentration negatively impacts on mitochondrial function eventually resulting in autophagic clearance of damaged mitochondria. MtROS are typically increased in cells overexpressing enzymatically active SIRT4 [35] (Fig. 1) together with a reduced oxygen consumption under basal and mitochondrial stress conditions (Fig. 4) [51]. In contrast, depletion of SIRT4 in HEK293 cells results in increased oxygen flux and improved mitochondrial function [51]. Consistent with this, we observed an increased O2 flow in HEK293 SIRT4(Δ28N)-eGFP cells both at basal and maximum respiration (Fig. 4), possibly reflecting a dominant-negative function of SIRT4(Δ28N). The latter may bind to wild-type SIRT4 and prevent it from mitochondrial translocation (that is dependent on the first 28 a.a.), given that recombinant SIRT4 as well as SIRT4 expressed in HEK293 cells forms homo-oligomeric to multimeric complexes in gel filtration analysis (own unpublished results). The molecular basis for the inhibitory and promoting effects of SIRT4 on mitochondrial respiration and mtROS generation, respectively, is likely connected to the functional inhibition of one or more SIRT4 targets in the inner mitochondrial membrane and matrix. For instance, SIRT4 negatively regulates key steps in anaplerosis of the citric acid cycle via different NAD+-dependent enzymatic reactions, i.e. ADP-ribosylation and inhibition of glutamate dehydrogenase (GDH) [42] or lipoamidase-mediated targeting and inhibition of the pyruvate dehydrogenase (PDH) complex [43]. Moreover, mass spectrometric characterization of the protein interaction network of SIRT4 identified components of mitochondrial complexes involved in oxidative phosphorylation, namely complex I, IV, and V [58], with complex I representing a major source of mtROS [59].
Besides their functions in energy metabolism and mitochondrial respiratory chain complexes [58], all three mtSIRTs participate in the regulation of mitochondrial morphology/dynamics and hence mitochondrial quality control through interaction with key fusion/fission regulators. SIRT3 promotes mitochondrial networking and functions by deacetylation and therefore activation of the fusion factor OPA1 thereby increasing its GTPase activity [37]. In the case of SIRT4, we now observed increased mitochondrial fusion (Fig. 5, 9, and 10) concomitant with an elevated mitochondrial content in cells overexpressing wild-type SIRT4, but not the catalytically inactive mutant H161Y. These findings were further corroborated by the novel physical link between SIRT4 and OPA1 that was evident in mass spectrometry analysis of SIRT4-eGFP binding partners (Lang et al., manuscript in preparation) and GFP-single-domain antibody (Fig. 7) as well as anti-OPA1 antibody (Suppl. Fig. 4) based co-immunoprecipitation experiments. The molecular mechanism leading to SIRT4 triggered increase in the L-OPA1/S-OPA1 ratio as well the interaction of SIRT4 with L-OPA1 (Fig. 7A and Suppl. Fig. 4) were dependent on the enzymatic activity of SIRT4 (Fig. 7B), and could involve the stabilization of L-OPA1 via (in)direct protein-protein interaction or protection from stress-induced and OMA1 mediated processing [60]. The elevated L-OPA1 levels in all cell models analyzed were associated with an increased mitochondrial fusion (Fig. 5, 9, and 10). Moreover, in line with our findings, a recent report linked SIRT4 to the regulation of mitochondrial dynamics via inhibition of ERK-mediated phosphorylation of the pro-fission factor DRP1, therefore inhibiting its activity and hence mitochondrial fission [41]. However, similar to the SIRT4-OPA1 interaction, the molecular mechanism by which SIRT4 impacts on the ERK-DRP1 axis is currently unclear and may require one or more of the known enzymatic activities of SIRT4 (ADP-ribosyltransferase, lipoamidase, or lysine deacylase [42-44];). Lastly, in the case of SIRT5, mitochondrial size was increased and mitophagy decreased upon SIRT5 overexpression, whereas the opposite effect was observed in SIRT5 silenced cells or upon treatment with the SIRT5 inhibitor MC3482 [40]. SIRT5 overexpression led to increased levels of the fusion factors OPA1 and MFN2, whereas at the same time the positive mitophagy regulators PINK2 and PARK1 were downregulated [40]. Consistent with this, SIRT5 has a protective role by preventing mitochondrial fragmentation during starvation, given that SIRT5 deficiency increases mitochondrial DRP1 levels and mitophagy [61]. Taken together, all three mtSIRTs seem to promote mitochondrial fusion and/or inhibit fission, and thus might attenuate mitophagic clearance of dysfunctional mitochondria. Of note, Ho et al. observed that higher SIRT4 levels trigger increased retrograde AMPK/PGC1α signaling from mitochondria to the nucleus [51]. However, this mechanism may rather mediate an increase in mitochondrial biogenesis to compensate for the accumulation of dysfunctional mitochondria which eventually did not undergo proper mitophagic clearance.
In summary, our findings are consistent with an inverse correlation between increased levels of the metabolic tumor suppressor SIRT4 in cellular senescence and aging [35,45] and cumulative evidence for declining autophagy with advanced age [18,22,24-27,56]. An increased content of mitochondria, which accumulate in a dysfunctional status, is characteristic for senescent cells [1,13]. Thus, we propose that stress/senescence induced SIRT4 functions via L-OPA1 as a novel determinant in the down-regulation of mitophagy during aging by shifting the mitochondrial fusion/fission cycle towards fusion.
Materials and Methods
Cell culture
HEK293 cells and primary human dermal fibroblasts isolated from foreskin [35] were cultured at 37°C and 5% CO2 in DMEM (Dulbecco's Modified Eagle Medium) containing high glucose (4.5 g/L; 11965092, Thermo Fisher Scientific) with 10% fetal bovine serum (FBS) and penicillin (100 units/mL)/streptomycin (100 μg/mL).
Cloning of SIRT4-eGFP expression constructs and generation of stable HEK293 lines
Full-length human SIRT4 (from pCMV6-SIRT4-Myc, Origene) and its mutants (H161Y, catalytically inactive; Δ28N, lacking the N-terminal mitochondrial translocation sequence) were cloned as C-terminal eGFP fusion proteins into pcDNA3.1. HEK293 cells were transfected using TurboFect (Thermo Fisher Scientific) and subjected to G418 (400 µg/ml) selection to generate stable cell lines. Expression of SIRT4-eGFP fusion constructs was validated by confocal microscopy, immunoblotting, and flow cytometry (Suppl. Fig. 1).
Measurement of mitochondrial reactive oxygen species (mtROS)
Cells were stained with cell-permeable dyes MitoTracker® Deep Red FM (100 µM; M22426) and MitoSOX™ Red (5 µM; M36008), both obtained from Thermo Fisher Scientific. The mitochondria-specific antioxidant MitoQ (10-(6’-ubiquinonyl) decyl triphenylphosphonium bromide) [47], kindly provided by Dr. Mike Murphy (Cambridge), was used to treat cells at a concentration of 100 nM for two days. Treatment of cells with the mitochondrial uncoupler CCCP (Carbonylcyanide m-chlorophenylhydrazone; 10 µM) occurred for two hours followed by harvesting and staining living cells in 1x PBS for 20 min. Analyses were performed with a BD FACSCanto™ II system (BD Biosciences) employing Flowing Software 2.5.1 (University of Turku, Finland).
Preparation of total cell lysates for immunoblot analysis
Cleared cell lysates were generated using lysis buffer containing 0.3% CHAPS (3-[(3-Cholamidopropyl) dimethylammonio]-1-propanesulfonate), 50 mM Tris-HCl (pH 7.4), 150 mM NaCl, 1 mM Na3VO4, 10 mM NaF, 1 mM EDTA, 1 mM EGTA, 2.5 mM Na4O7P2, 1 µM DTT, 1x cOmplete™ protease inhibitor cocktail (CO-RO, Sigma-Aldrich). Lysates were cleared by centrifugation (11.000 x g at 4°C for 20 min). Protein concentration of the supernatants was determined using the Bradford assay (K015.1, Roth).
Immunoprecipitation of eGFP fusion proteins
The single-domain-anti-GFP antibody (“nanobody”) method [62,63] was employed to immunoprecipitate SIRT4-eGFP fusion proteins. Total cell lysates from HEK293 cells stably expressing eGFP, SIRT4-eGFP, SIRT4(H161Y)-eGFP, or SIRT4(Δ28N)-eGFP were prepared as described above. Two mg protein was diluted together with 10 µl single-domain-anti-GFP antibody beads in a final volume of 400 µl lysis buffer [0.3% CHAPS, 50 mM Tris-HCl (pH 7.4), 150 mM NaCl, 1 mM Na3VO4, 10 mM NaF, 1 mM EDTA, 1 mM EGTA, 2.5 mM Na4O7P2, 1 µM DTT, 1x cOmplete™ protease inhibitor cocktail). This mixture was incubated overnight at 4°C under rotation. On the next day, the beads were washed four-times with 1 ml washing buffer (lysis buffer without cOmplete™ protease inhibitor cocktail) followed by incubation in Laemmli loading buffer at 95°C for 5 min. Samples and total cell lysates (5% of input) were subjected to SDS-PAGE (10% gels) and proteins were transferred on nitrocellulose membranes (Hybond C, GE Healthcare). Membranes were incubated overnight at 4°C with antibodies against OPA1 [55], TACC3 (sc-22773, Santa Cruz Biotechnology), or GFP (11814460001, Roche Molecular Systems) which were diluted 1:1000 in TBS containing 0.05% Tween 20.
Measurement of autophagic flux by LC3B-II immunoblot analysis
HEK293 cells were seeded on six-well-plates and cultured for two days at 37°C and 5% CO2. To induce autophagy or selective autophagy of mitochondria (mitophagy) cells were treated with 100 nM Rapamycin or 10 µM CCCP (Carbonylcyanide m-chlorophenylhydrazone; 857815, Sigma-Aldrich), respectively, for two hours. During the second hour cells were co-treated with (Bafilomycin A; 100 nM; Invivogen) to stall autophagic flux via inhibition of the fusion between lysosomes and autophagosomes. Total cell lysates (50 µg) were analyzed on 13.5% SDS-PAGE gels. Antibodies detecting both LC3B-I/ LC3B-II (#2775, Cell Signaling Technology) and β-actin/ACTB (MAB1501, Millipore) were diluted 1:1000 in TBS-Tween (0.05%) and incubated on immunoblot membranes overnight at 4°C. Primary antibodies were detected by IRDye® 680RD goat anti-mouse IgG (P/N 925-68070, LI-COR) and IRDye® 800CW goat anti-rabbit IgG (P/N 925-32211, LI-COR) secondary antibodies using the Odyssey® Imaging System (LI-COR Biosciences).
Immunofluorescence and confocal laser scanning microscopy to analyze mitophagy
HEK293 cells stably expressing eGFP, SIRT4-eGFP, SIRT4(H161Y)-eGFP, or SIRT4(Δ28N)-eGFP were transfected with pCMV6-mCherry-Parkin (PARK2) and treated with 10 µM CCCP together with 100 nM Bafilomycin A1 for two hours on the next day, as described above. Cells were fixed in 4% paraformaldehyde for 20 min and permeabilized with 0.2% Triton X-100 for 20 min followed by a blocking step with 4% BSA/0.05% saponin for 30 min at room temperature. Cells were co-stained with primary antibodies against the mitochondrial marker MTC02 (abcam, ab3298; 1:500), and α-Tubulin/TUBA1B (Acris antibodies, SM568P; 1:500) overnight at 4°C. Secondary antibodies (Alexa Fluor 546-conjugated goat anti-mouse IgG and Alexa Fluor 633-conjugated goat anti-rat IgG) were from Life Technologies and used at a dilution of 1:500 for one hour at room temperature. Analyzes were performed with a LSM510-Meta confocal microscope (Zeiss) equipped with 40/1.3 immersion objectives and emission wavelengths of 468 nm, 488 nm, 543 nm, and 633 nm. Quantification of mCherry-Parkin dots was performed based on the mitochondrial content (MTC02 signal) using ImageJ software v1.49k and a specific macro (Suppl. Material & Methods).
Immunofluorescence and confocal laser scanning microscopy to analyze mitochondrial morphology and mitochondrial fusion/tube formation
To obtain high resolution pictures for analysis of mitochondrial morphology HEK293 cells and primary human dermal fibroblasts were co-stained with antibodies against MTC02 (Abcam, ab3298; 1:500) and α-Tubulin (Abcam, ab52866, 1:500) overnight at 4°C. To increase detection of SIRT4-eGFP fusion proteins (in the case of stably transfected HEK293 cells) primary antibodies against GFP (Nacalai Tesque, Inc., GF090R, 1:1000) were employed. Secondary antibodies were Alexa Fluor 488-conjugated goat anti-rat, Alexa Fluor 546-conjugated goat anti-mouse IgG, and Alexa Fluor 633-conjugated goat anti-rabbit IgG. Acquisitions were performed with the UltraVIEW spinning disk confocal microscope (Perkin Elmer) with emission wavelengths of 468 nm, 488 nm, 543 nm, and 633 nm and the Volocity 6.3 software (Perkin Elmer). Pictures were further analyzed using ImageJ software v1.49k employing specific macros for the analysis of mitochondrial mass and mitochondrial tube formation/length analysis (Suppl. Material & Methods).
Respirometric measurements
Oxygen consumption was determined in HEK293 cells (106/ml media) stably expressing eGFP, SIRT4-eGFP, SIRT4(H161Y)-eGFP, or SIRT4(Δ28N)-eGFP under basal and stress conditions as compared to control cells expressing eGFP. Measurement were performed essentially as described [52,64] (leak: treatment with oligomycin A, 2 µg/ml; ETS: mitochondrial uncoupling of the electron transport system using CCCP, 400-500 nM; residual oxygen consumption, ROX: treatment with 500 nM rotenone and 2.5 µM antimycin A).
Transfection of oligonucleotides
Primary human dermal fibroblasts were transfected with miR-15b inhibitors (or control oligonucleotides) with or without SIRT4 siRNA duplexes to modulate SIRT4 expression essentially as described [35]. Transfection efficiency was controlled by co-transfection of siGLO Red transfection indicators (GE Dharmacon).
Ionizing γ-irradiation (γIR)
Primary human dermal fibroblasts were transfected with siRNA duplexes against SIRT4 essentially as described [35]. Following 24h, cells were exposed to γIR (one dose of 20 Gy; 175 kV and 15 mA) using a Gulmay RS225 X-ray system from X-Strahl (Camberley, UK) and were cultured for another three days before analysis.
Statistical analysis
Data are presented as mean ± s.d. Multiple comparisons were analyzed by one-way or two-way analysis of variance (ANOVA) employing the GraphPad Prism software.
ABBREVATIONS
BafA1: Bafilomycin A1; CCCP: Carbonylcyanide m-chlorophenylhydrazone; γIR: gamma-irradiation; ETC: electron transport chain; GDH: glutamate dehydrogenase; miRNA: microRNA; mitoQ: 10-(6’-ubiquinonyl) decyltriphenylphosphoniumbromide; mtSIRT: mitochondrially localized sirtuin; OPA1: optic atrophy gene 1; ΔΨm: mitochondrial membrane potential; mtROS: mitochondrial reactive oxygen species; ROX: residual oxygen consumption; SASP: senescence associated secretory phenotype.
Supplementary Materials
Acknowledgements
We thank Katharina Schmitz, Chris Wichmann, Reza Ahmadian, and members of the institute for discussions and comments on the manuscript, Jan Borchert for help with ImageJ software, Axel Gödecke for use of the LI-COR imaging system, and Mike Murphy (Cambridge) and Marc Majora for sharing MitoQ.
Conflicts of Interest
The authors state no conflict of interest.
Funding
Strategischer Forschungsfond (grant 701.301.987) of the Heinrich-Heine-University (to R.P.P.), the research commission (grant 9772643) of the Medical Faculty of the Heinrich-Heine-University (to R.P.P.), and Deutsche Forschungsgemeinschaft SFB728 project A05 (to R.P.P). Deutsche Forschungsgemeinschaft SFB594 project B09 (to A.S.R) and research commission grant 2/2015 by the Medical Faculty of the Heinrich-Heine-University Düsseldorf (to. R.A. and A.S.R.).
References
- 1. López-Otín C, Blasco MA, Partridge L, Serrano M, Kroemer G. The hallmarks of aging. Cell. 2013; 153:1194–217. https://doi.org/10.1016/j.cell.2013.05.039 [PubMed]
- 2. Campisi J, d’Adda di Fagagna F. Cellular senescence: when bad things happen to good cells. Nat Rev Mol Cell Biol. 2007; 8:729–40. https://doi.org/10.1038/nrm2233 [PubMed]
- 3. Hayflick L, Moorhead PS. The serial cultivation of human diploid cell strains. Exp Cell Res. 1961; 25:585–621. https://doi.org/10.1016/0014-4827(61)90192-6 [PubMed]
- 4. Rodier F, Campisi J. Four faces of cellular senescence. J Cell Biol. 2011; 192:547–56. https://doi.org/10.1083/jcb.201009094 [PubMed]
- 5. Cavinato M, Jansen-Dürr P. Molecular mechanisms of UVB-induced senescence of dermal fibroblasts and its relevance for photoaging of the human skin. Exp Gerontol. 2017; 94:78–82. https://doi.org/10.1016/j.exger.2017.01.009 [PubMed]
- 6. Krutmann J, Gilchrest BA. (2006). Photoaging of skin. In: Skin Aging (Gilchrest BA, Krutmann J). (New York: Springer), pp. 33-44.
- 7. Tigges J, Krutmann J, Fritsche E, Haendeler J, Schaal H, Fischer JW, Kalfalah F, Reinke H, Reifenberger G, Stühler K, Ventura N, Gundermann S, Boukamp P, Boege F. The hallmarks of fibroblast ageing. Mech Ageing Dev. 2014; 138:26–44. https://doi.org/10.1016/j.mad.2014.03.004 [PubMed]
- 8. Baker DJ, Childs BG, Durik M, Wijers ME, Sieben CJ, Zhong J, Saltness RA, Jeganathan KB, Verzosa GC, Pezeshki A, Khazaie K, Miller JD, van Deursen JM. Naturally occurring p16(Ink4a)-positive cells shorten healthy lifespan. Nature. 2016; 530:184–89. https://doi.org/10.1038/nature16932 [PubMed]
- 9. Baker DJ, Wijshake T, Tchkonia T, LeBrasseur NK, Childs BG, van de Sluis B, Kirkland JL, van Deursen JM. Clearance of p16Ink4a-positive senescent cells delays ageing-associated disorders. Nature. 2011; 479:232–36. https://doi.org/10.1038/nature10600 [PubMed]
- 10. Georgakilas AG, Martin OA, Bonner WM. p21: A Two-Faced Genome Guardian. Trends Mol Med. 2017; 23:310–19. https://doi.org/10.1016/j.molmed.2017.02.001 [PubMed]
- 11. Singh M, Piekorz RP. Senescence-associated lysosomal α-L-fucosidase (SA-α-Fuc): a sensitive and more robust biomarker for cellular senescence beyond SA-β-Gal. Cell Cycle. 2013; 12:1996. https://doi.org/10.4161/cc.25318 [PubMed]
- 12. Ju Z, Choudhury AR, Rudolph KL. A dual role of p21 in stem cell aging. Ann N Y Acad Sci. 2007; 1100:333–44. https://doi.org/10.1196/annals.1395.036 [PubMed]
- 13. Passos JF, Nelson G, Wang C, Richter T, Simillion C, Proctor CJ, Miwa S, Olijslagers S, Hallinan J, Wipat A, Saretzki G, Rudolph KL, Kirkwood TB, von Zglinicki T. Feedback between p21 and reactive oxygen production is necessary for cell senescence. Mol Syst Biol. 2010; 6:347. https://doi.org/10.1038/msb.2010.5 [PubMed]
- 14. Correia-Melo C, Marques FD, Anderson R, Hewitt G, Hewitt R, Cole J, Carroll BM, Miwa S, Birch J, Merz A, Rushton MD, Charles M, Jurk D, et al. Mitochondria are required for pro-ageing features of the senescent phenotype. EMBO J. 2016; 35:724–42. https://doi.org/10.15252/embj.201592862 [PubMed]
- 15. Wiley CD, Velarde MC, Lecot P, Liu S, Sarnoski EA, Freund A, Shirakawa K, Lim HW, Davis SS, Ramanathan A, Gerencser AA, Verdin E, Campisi J. Mitochondrial dysfunction induces senescence with a distinct secretory phenotype. Cell Metab. 2016; 23:303–14. https://doi.org/10.1016/j.cmet.2015.11.011 [PubMed]
- 16. Mai S, Klinkenberg M, Auburger G, Bereiter-Hahn J, Jendrach M. Decreased expression of Drp1 and Fis1 mediates mitochondrial elongation in senescent cells and enhances resistance to oxidative stress through PINK1. J Cell Sci. 2010; 123:917–26. https://doi.org/10.1242/jcs.059246 [PubMed]
- 17. Stab BR
2nd , Martinez L, Grismaldo A, Lerma A, Gutiérrez ML, Barrera LA, Sutachan JJ, Albarracín SL. Mitochondrial functional changes characterization in young and senescent human adipose derived MSCs. Front Aging Neurosci. 2016; 8:299. https://doi.org/10.3389/fnagi.2016.00299 [PubMed] - 18. Hamacher-Brady A, Brady NR. Mitophagy programs: mechanisms and physiological implications of mitochondrial targeting by autophagy. Cell Mol Life Sci. 2016; 73:775–95. https://doi.org/10.1007/s00018-015-2087-8 [PubMed]
- 19. Komatsu M, Ichimura Y. Selective autophagy regulates various cellular functions. Genes Cells. 2010; 15:923–33. https://doi.org/10.1111/j.1365-2443.2010.01433.x [PubMed]
- 20. Twig G, Shirihai OS. The interplay between mitochondrial dynamics and mitophagy. Antioxid Redox Signal. 2011; 14:1939–51. https://doi.org/10.1089/ars.2010.3779 [PubMed]
- 21. Diot A, Morten K, Poulton J. Mitophagy plays a central role in mitochondrial ageing. Mamm Genome. 2016; 27:381–95. https://doi.org/10.1007/s00335-016-9651-x [PubMed]
- 22. Gaziev AI, Abdullaev S, Podlutsky A. Mitochondrial function and mitochondrial DNA maintenance with advancing age. Biogerontology. 2014; 15:417–38. https://doi.org/10.1007/s10522-014-9515-2 [PubMed]
- 23. Kalfalah F, Janke L, Schiavi A, Tigges J, Ix A, Ventura N, Boege F, Reinke H. Crosstalk of clock gene expression and autophagy in aging. Aging (Albany NY). 2016; 8:1876–95. https://doi.org/10.18632/aging.101018 [PubMed]
- 24. Korolchuk VI, Miwa S, Carroll B, von Zglinicki T. Mitochondria in cell senescence: is mitophagy the weak link? EBioMedicine. 2017; 21:7–13. https://doi.org/10.1016/j.ebiom.2017.03.020 [PubMed]
- 25. López-Lluch G, Santos-Ocaña C, Sánchez-Alcázar JA, Fernández-Ayala DJ, Asencio-Salcedo C, Rodríguez-Aguilera JC, Navas P. Mitochondrial responsibility in ageing process: innocent, suspect or guilty. Biogerontology. 2015; 16:599–620. https://doi.org/10.1007/s10522-015-9585-9 [PubMed]
- 26. Rubinsztein DC, Mariño G, Kroemer G. Autophagy and aging. Cell. 2011; 146:682–95. https://doi.org/10.1016/j.cell.2011.07.030 [PubMed]
- 27. Weber TA, Reichert AS. Impaired quality control of mitochondria: aging from a new perspective. Exp Gerontol. 2010; 45:503–11. https://doi.org/10.1016/j.exger.2010.03.018 [PubMed]
- 28. García-Prat L, Martínez-Vicente M, Perdiguero E, Ortet L, Rodríguez-Ubreva J, Rebollo E, Ruiz-Bonilla V, Gutarra S, Ballestar E, Serrano AL, Sandri M, Muñoz-Cánoves P. Autophagy maintains stemness by preventing senescence. Nature. 2016; 529:37–42. https://doi.org/10.1038/nature16187 [PubMed]
- 29. García-Prat L, Muñoz-Cánoves P, Martinez-Vicente M. Dysfunctional autophagy is a driver of muscle stem cell functional decline with aging. Autophagy. 2016; 12:612–13. https://doi.org/10.1080/15548627.2016.1143211 [PubMed]
- 30. Haigis MC, Sinclair DA. Mammalian sirtuins: biological insights and disease relevance. Annu Rev Pathol. 2010; 5:253–95. https://doi.org/10.1146/annurev.pathol.4.110807.092250 [PubMed]
- 31. Li X, Kazgan N. Mammalian sirtuins and energy metabolism. Int J Biol Sci. 2011; 7:575–87. https://doi.org/10.7150/ijbs.7.575 [PubMed]
- 32. Pirinen E, Lo Sasso G, Auwerx J. Mitochondrial sirtuins and metabolic homeostasis. Best Pract Res Clin Endocrinol Metab. 2012; 26:759–70. https://doi.org/10.1016/j.beem.2012.05.001 [PubMed]
- 33. van de Ven RA, Santos D, Haigis MC. Mitochondrial sirtuins and molecular mechanisms of aging. Trends Mol Med. 2017; 23:320–31. https://doi.org/10.1016/j.molmed.2017.02.005 [PubMed]
- 34. Buler M, Andersson U, Hakkola J. Who watches the watchmen? Regulation of the expression and activity of sirtuins. FASEB J. 2016; 30:3942–60. https://doi.org/10.1096/fj.201600410RR [PubMed]
- 35. Lang A, Grether-Beck S, Singh M, Kuck F, Jakob S, Kefalas A, Altinoluk-Hambüchen S, Graffmann N, Schneider M, Lindecke A, Brenden H, Felsner I, Ezzahoini H, et al. MicroRNA-15b regulates mitochondrial ROS production and the senescence-associated secretory phenotype through sirtuin 4/SIRT4. Aging (Albany NY). 2016; 8:484–505. https://doi.org/10.18632/aging.100905 [PubMed]
- 36. Castex J, Willmann D, Kanouni T, Arrigoni L, Li Y, Friedrich M, Schleicher M, Wöhrle S, Pearson M, Kraut N, Méret M, Manke T, Metzger E, et al. Inactivation of Lsd1 triggers senescence in trophoblast stem cells by induction of Sirt4. Cell Death Dis. 2017; 8:e2631. https://doi.org/10.1038/cddis.2017.48 [PubMed]
- 37. Samant SA, Zhang HJ, Hong Z, Pillai VB, Sundaresan NR, Wolfgeher D, Archer SL, Chan DC, Gupta MP. SIRT3 deacetylates and activates OPA1 to regulate mitochondrial dynamics during stress. Mol Cell Biol. 2014; 34:807–19. https://doi.org/10.1128/MCB.01483-13 [PubMed]
- 38. Osborne B, Bentley NL, Montgomery MK, Turner N. The role of mitochondrial sirtuins in health and disease. Free Radic Biol Med. 2016; 100:164–74. https://doi.org/10.1016/j.freeradbiomed.2016.04.197 [PubMed]
- 39. Yang L, Ma X, He Y, Yuan C, Chen Q, Li G, Chen X. Sirtuin 5: a review of structure, known inhibitors and clues for developing new inhibitors. Sci China Life Sci. 2017; 60:249–56. https://doi.org/10.1007/s11427-016-0060-7 [PubMed]
- 40. Polletta L, Vernucci E, Carnevale I, Arcangeli T, Rotili D, Palmerio S, Steegborn C, Nowak T, Schutkowski M, Pellegrini L, Sansone L, Villanova L, Runci A, et al. SIRT5 regulation of ammonia-induced autophagy and mitophagy. Autophagy. 2015; 11:253–70. https://doi.org/10.1080/15548627.2015.1009778 [PubMed]
- 41. Fu L, Dong Q, He J, Wang X, Xing J, Wang E, Qiu X, Li Q. SIRT4 inhibits malignancy progression of NSCLCs, through mitochondrial dynamics mediated by the ERK-Drp1 pathway. Oncogene. 2017; 36:2724–36. https://doi.org/10.1038/onc.2016.425 [PubMed]
- 42. Haigis MC, Mostoslavsky R, Haigis KM, Fahie K, Christodoulou DC, Murphy AJ, Valenzuela DM, Yancopoulos GD, Karow M, Blander G, Wolberger C, Prolla TA, Weindruch R, et al. SIRT4 inhibits glutamate dehydrogenase and opposes the effects of calorie restriction in pancreatic beta cells. Cell. 2006; 126:941–54. https://doi.org/10.1016/j.cell.2006.06.057 [PubMed]
- 43. Mathias RA, Greco TM, Oberstein A, Budayeva HG, Chakrabarti R, Rowland EA, Kang Y, Shenk T, Cristea IM. Sirtuin 4 is a lipoamidase regulating pyruvate dehydrogenase complex activity. Cell. 2014; 159:1615–25. https://doi.org/10.1016/j.cell.2014.11.046 [PubMed]
- 44. Anderson KA, Huynh FK, Fisher-Wellman K, Stuart JD, Peterson BS, Douros JD, Wagner GR, Thompson JW, Madsen AS, Green MF, Sivley RM, Ilkayeva OR, Stevens RD, et al. SIRT4 is a lysine deacylase that controls leucine metabolism and insulin secretion. Cell Metab. 2017; 25:838–855.e15. https://doi.org/10.1016/j.cmet.2017.03.003 [PubMed]
- 45. Jeong SM, Xiao C, Finley LW, Lahusen T, Souza AL, Pierce K, Li YH, Wang X, Laurent G, German NJ, Xu X, Li C, Wang RH, et al. SIRT4 has tumor-suppressive activity and regulates the cellular metabolic response to DNA damage by inhibiting mitochondrial glutamine metabolism. Cancer Cell. 2013; 23:450–63. https://doi.org/10.1016/j.ccr.2013.02.024 [PubMed]
- 46. Ahuja N, Schwer B, Carobbio S, Waltregny D, North BJ, Castronovo V, Maechler P, Verdin E. Regulation of insulin secretion by SIRT4, a mitochondrial ADP-ribosyltransferase. J Biol Chem. 2007; 282:33583–92. https://doi.org/10.1074/jbc.M705488200 [PubMed]
- 47. Murphy MP. Understanding and preventing mitochondrial oxidative damage. Biochem Soc Trans. 2016; 44:1219–26. https://doi.org/10.1042/BST20160108 [PubMed]
- 48. Saretzki G, Murphy MP, von Zglinicki T. MitoQ counteracts telomere shortening and elongates lifespan of fibroblasts under mild oxidative stress. Aging Cell. 2003; 2:141–43. https://doi.org/10.1046/j.1474-9728.2003.00040.x [PubMed]
- 49. Held NM, Houtkooper RH. Mitochondrial quality control pathways as determinants of metabolic health. BioEssays. 2015; 37:867–76. https://doi.org/10.1002/bies.201500013 [PubMed]
- 50. de Moura MB, Uppala R, Zhang Y, Van Houten B, Goetzman ES. Overexpression of mitochondrial sirtuins alters glycolysis and mitochondrial function in HEK293 cells. PLoS One. 2014; 9:e106028. https://doi.org/10.1371/journal.pone.0106028 [PubMed]
- 51. Ho L, Titus AS, Banerjee KK, George S, Lin W, Deota S, Saha AK, Nakamura K, Gut P, Verdin E, Kolthur-Seetharam U. SIRT4 regulates ATP homeostasis and mediates a retrograde signaling via AMPK. Aging (Albany NY). 2013; 5:835–49. https://doi.org/10.18632/aging.100616 [PubMed]
- 52. Anand R, Strecker V, Urbach J, Wittig I, Reichert AS. Mic13 is essential for formation of crista junctions in mammalian cells. PLoS One. 2016; 11:e0160258. https://doi.org/10.1371/journal.pone.0160258 [PubMed]
- 53. MacVicar T, Langer T. OPA1 processing in cell death and disease - the long and short of it. J Cell Sci. 2016; 129:2297–306. https://doi.org/10.1242/jcs.159186 [PubMed]
- 54. MacVicar TD, Lane JD. Impaired OMA1-dependent cleavage of OPA1 and reduced DRP1 fission activity combine to prevent mitophagy in cells that are dependent on oxidative phosphorylation. J Cell Sci. 2014; 127:2313–25. https://doi.org/10.1242/jcs.144337 [PubMed]
- 55. Barrera M, Koob S, Dikov D, Vogel F, Reichert AS. OPA1 functionally interacts with MIC60 but is dispensable for crista junction formation. FEBS Lett. 2016; 590:3309–22. https://doi.org/10.1002/1873-3468.12384 [PubMed]
- 56. Biala AK, Dhingra R, Kirshenbaum LA. Mitochondrial dynamics: orchestrating the journey to advanced age. J Mol Cell Cardiol. 2015; 83:37–43. https://doi.org/10.1016/j.yjmcc.2015.04.015 [PubMed]
- 57. Sies H, Berndt C, Jones DP. Oxidative Stress. Annu Rev Biochem. 2017; 86:715–48. https://doi.org/10.1146/annurev-biochem-061516-045037 [PubMed]
- 58. Yang W, Nagasawa K, Münch C, Xu Y, Satterstrom K, Jeong S, Hayes SD, Jedrychowski MP, Vyas FS, Zaganjor E, Guarani V, Ringel AE, Gygi SP, et al. Mitochondrial Sirtuin network reveals dynamic SIRT3-dependent deacetylation in response to membrane depolarization. Cell. 2016; 167:985–1000.e21. https://doi.org/10.1016/j.cell.2016.10.016 [PubMed]
- 59. Dröse S, Brandt U, Wittig I. Mitochondrial respiratory chain complexes as sources and targets of thiol-based redox-regulation. Biochim Biophys Acta. 2014; 1844:1344–54. https://doi.org/10.1016/j.bbapap.2014.02.006 [PubMed]
- 60. Korwitz A, Merkwirth C, Richter-Dennerlein R, Tröder SE, Sprenger HG, Quirós PM, López-Otín C, Rugarli EI, Langer T. Loss of OMA1 delays neurodegeneration by preventing stress-induced OPA1 processing in mitochondria. J Cell Biol. 2016; 212:157–66. https://doi.org/10.1083/jcb.201507022 [PubMed]
- 61. Guedouari H, Daigle T, Scorrano L, Hebert-Chatelain E. Sirtuin 5 protects mitochondria from fragmentation and degradation during starvation. Biochim Biophys Acta. 2017; 1864:169–76. https://doi.org/10.1016/j.bbamcr.2016.10.015 [PubMed]
- 62. Franke M, Schröder J, Monhasery N, Ackfeld T, Hummel TM, Rabe B, Garbers C, Becker-Pauly C, Floss DM, Scheller J. Human and murine interleukin 23 receptors are novel substrates for a disintegrin and metalloproteases ADAM10 and ADAM17. J Biol Chem. 2016; 291:10551–61. https://doi.org/10.1074/jbc.M115.710541 [PubMed]
- 63. Rothbauer U, Zolghadr K, Muyldermans S, Schepers A, Cardoso MC, Leonhardt H. A versatile nanotrap for biochemical and functional studies with fluorescent fusion proteins. Mol Cell Proteomics. 2008; 7:282–89. https://doi.org/10.1074/mcp.M700342-MCP200 [PubMed]
- 64. Pesta G, Gnaiger E. (2012). High-Resolution Respirometry: OXPHOS Protocols for Human Cells and Permeabilized Fibers from Small Biopsies of Human Muscle. In: Palmeira C and Moreno AJ, eds. Methods in Molecular Biology: Springer Science+Business Media, pp. 25-58.