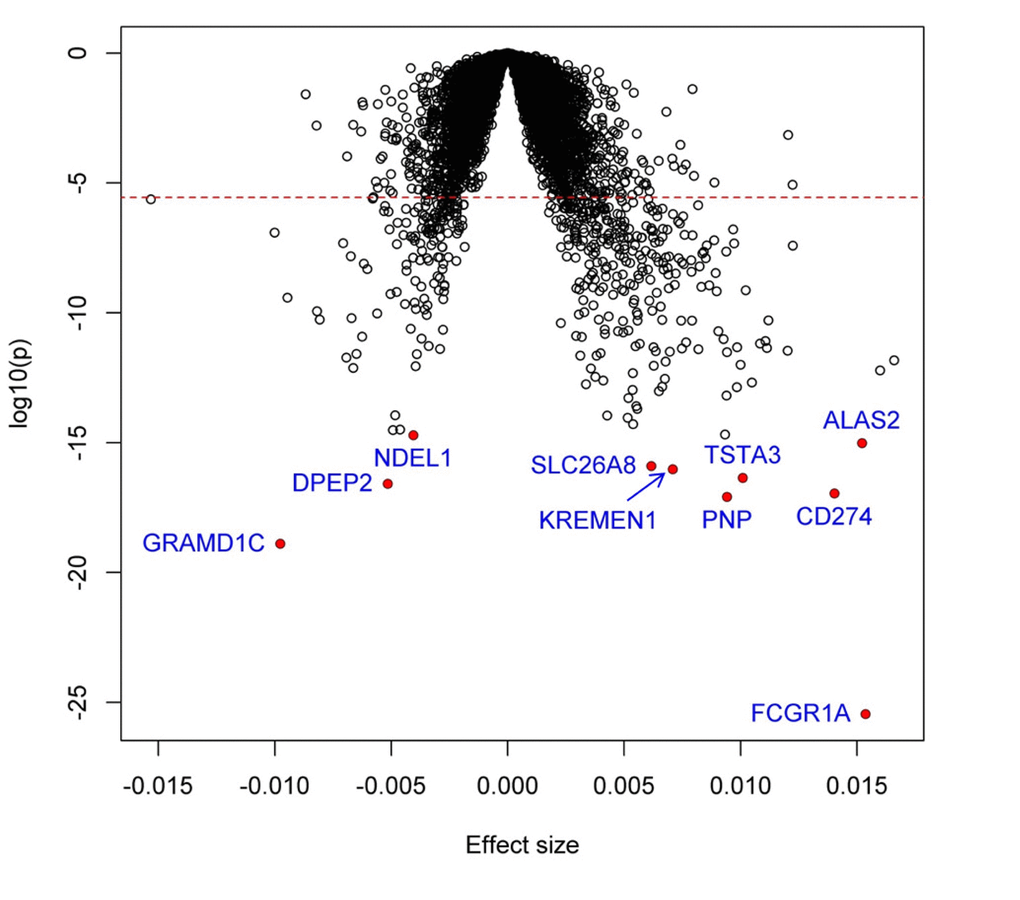
Figure 1.Volcano plot of association with inflammatory ∆age. Each dot represents one gene. The x-axis represents the beta estimation (β) of each gene, whereas the y-axis represents the log10(P). Positive effects represent that the genes were positively associated with inflammatory ∆age, whereas negative effects represent that the genes were negatively associated with inflammatory ∆age. The red dash line indicates P<0.05/17873=2.8x10-6.