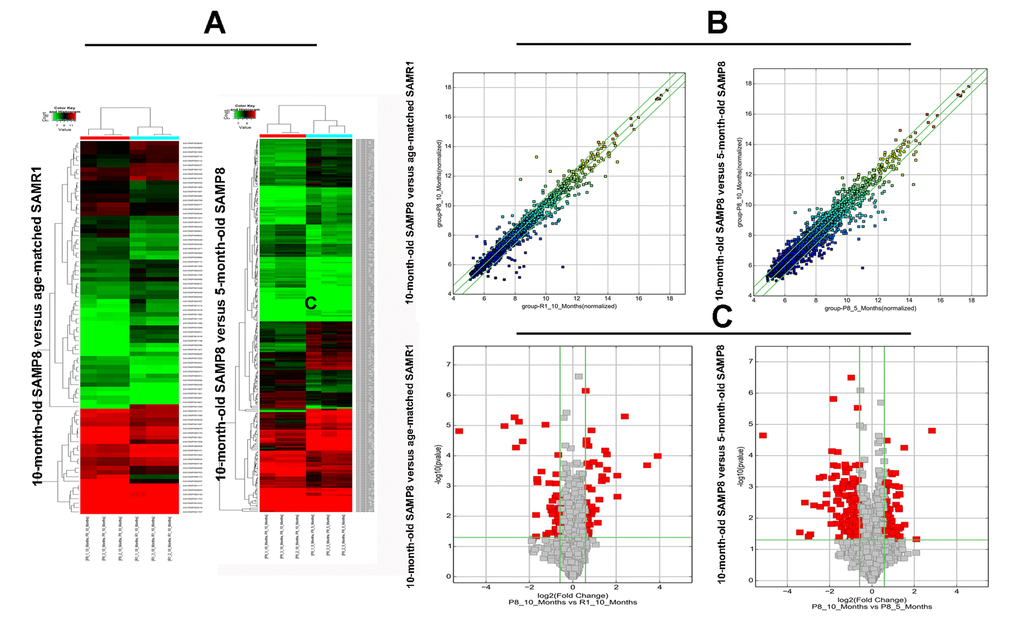
Figure 2.The hierarchical cluster, scatter plot and volcano plot of differential expression of circRNAs in 10-month-old SAMP8 versus age-matched SAMR1 and 10-month-old SAMP8 versus 5-month-old SAMP8. (A) Hierarchical cluster of differentially expressed circRNAs. “green” indicates low intensity, “black” indicates medium intensity and “red” indicates strong intensity. (B) Scatter plot of circRNA signal values. The values of X and Y axes represents the normalized signal values of the samples (log2 scaled) and the averaged normalized signal values of samples (log2 scaled) respectively. The green lines are fold change lines. The CircRNAs above the top green line and below the bottom green line demonstrates more than 1.5-fold change of circRNAs between the two compared samples. (C) Volcano plot of differential expression of circRNAs. The vertical lines correspond to 1.5-fold up and down, respectively. The horizontal line represents a P-value of 0.05, and the red point in the plot represents the differentially expressed circRNAs with statistical significance.