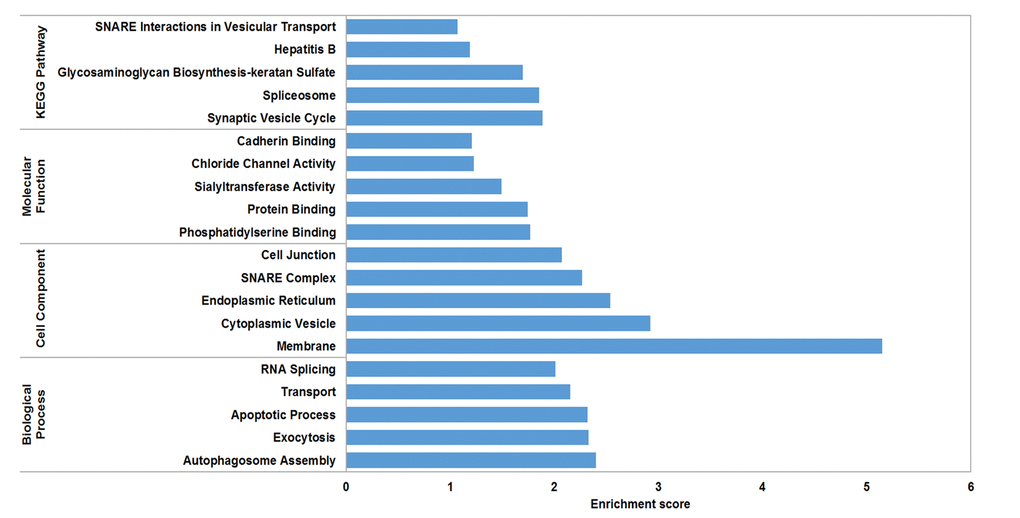
Figure 6.GO analysis according to the mmu_circRNA_017963-miRNAs-mRNAs network. The x- and y-axis represent the top 5 significantly enriched biological processes, cell component and molecular function and their scores (-log10 (P value)), respectively. The horizontal axis represents the significant level of GOs and KEGG pathways.