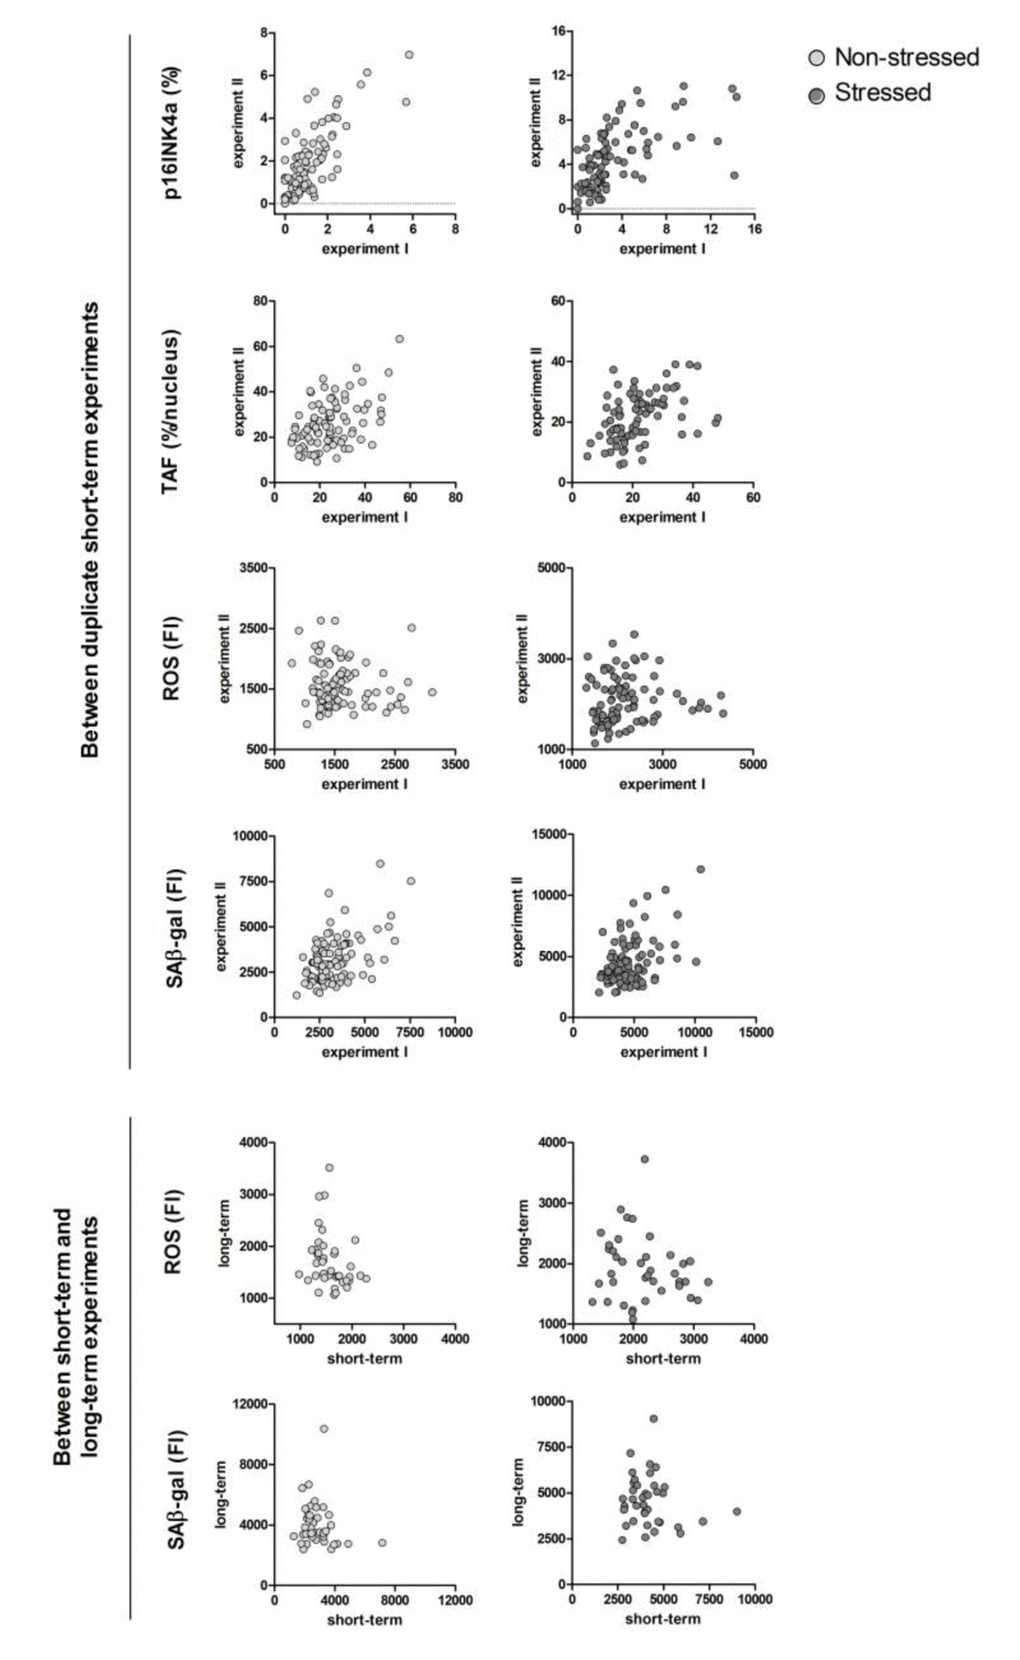
Figure 1.Correlation plots of the same senescence markers between duplicate experiments and between short-term versus long-term experiments. Each dot represents an individual donor, N=40-100. Uncorrected (not log transformed) data points are shown. P16INK4a: percentage of p16INK4a positive cells; TAF (telomere associated foci): percentage of nuclei with ≥1 TAF/nucleus; ROS: mean fluorescence intensity peak reactive oxygen species; SAβ-gal: median fluorescence intensity peak senescence-associated β galactosidase. For the between short-term and long-term experiment correlations, in vitro variables are the mean of short-term experiments.