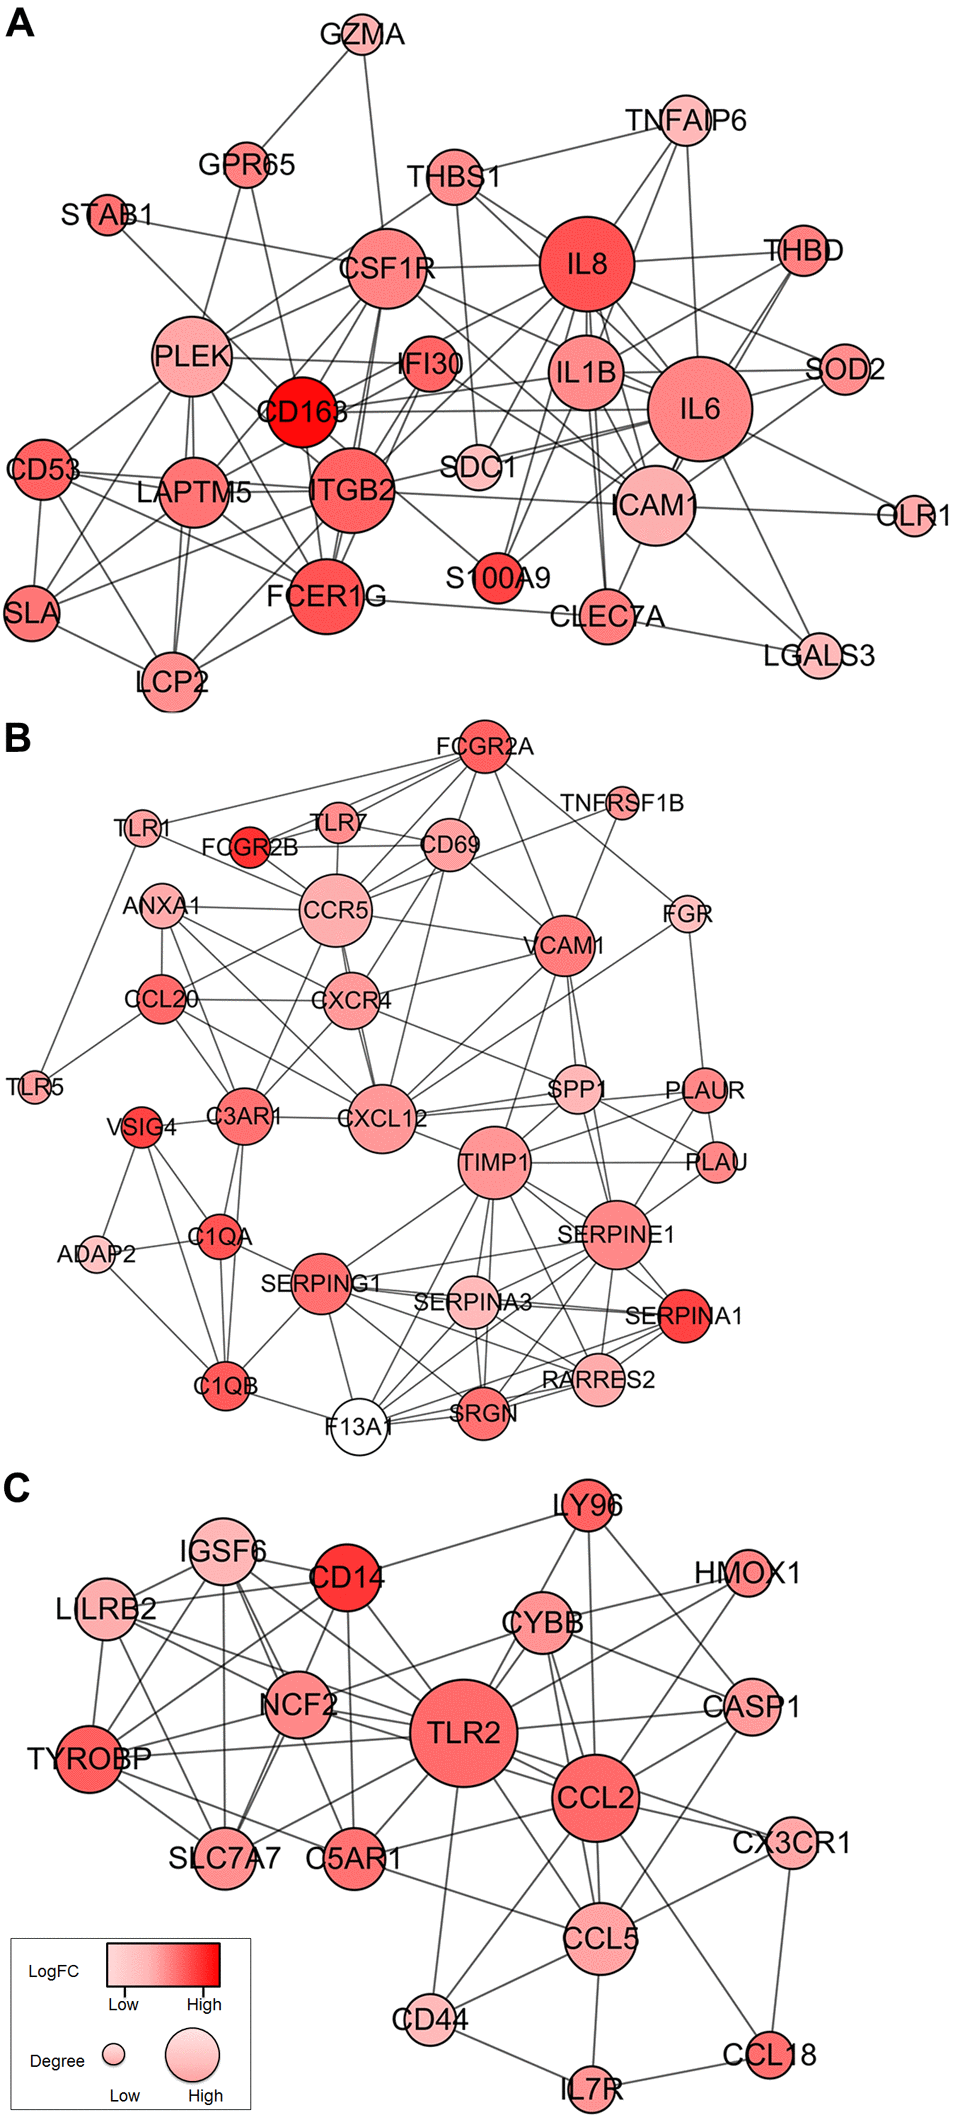
Figure 4.Top 3 PPI networks of IL6, TIMP1, and TLR2 modules. The color of a node in the PPI network reflects the log (FC) value of the Z score of gene expression, and the size of node indicates the number of interacting proteins with the designated protein.