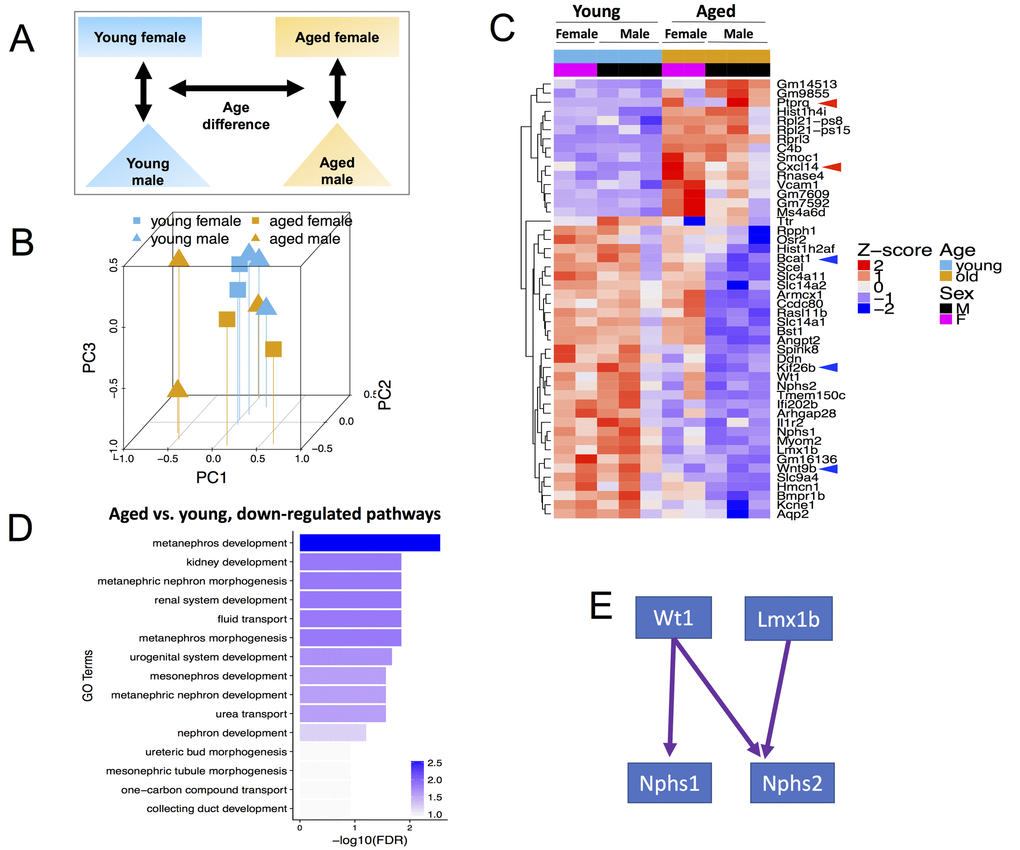
Figure 1.Global transcriptome changes associated with CoRL aging when both male and female mice are included in the analysis. (A) Schema showing comparisons made included age and both sexes. (B) Principal Component Analysis (PCA) plot of all (n=10) RNA-seq samples. PC1 represents the largest variation in gene expression, followed by PC2, then PC3. Blue and mustard colors denote young and aged mice respectively; squares and triangles denote female and male sex respectively. Young female, young male, aged female and aged male samples mostly tend to cluster together. (C) Heat map of all samples showing clusters of genes with consistent changes in aged male and aged female mice compared to young sex counterparts. The Z-score colors are shown, with blue indicating genes with lower than overall mean expression levels, and red indicating genes with higher than mean expression levels. (D) In aged female and male mice, clustering by Gene Ontology (GO) terms identified the consistently down-regulated genes as metanephros development, kidney development and metaneprhic nephron morphogenesis. (E) The developmental transcription factors, Wt1 and Lmx1b, and their key target genes, nephrin (Nphs1) and podocin (Nphs2) were down-regulated in aging.