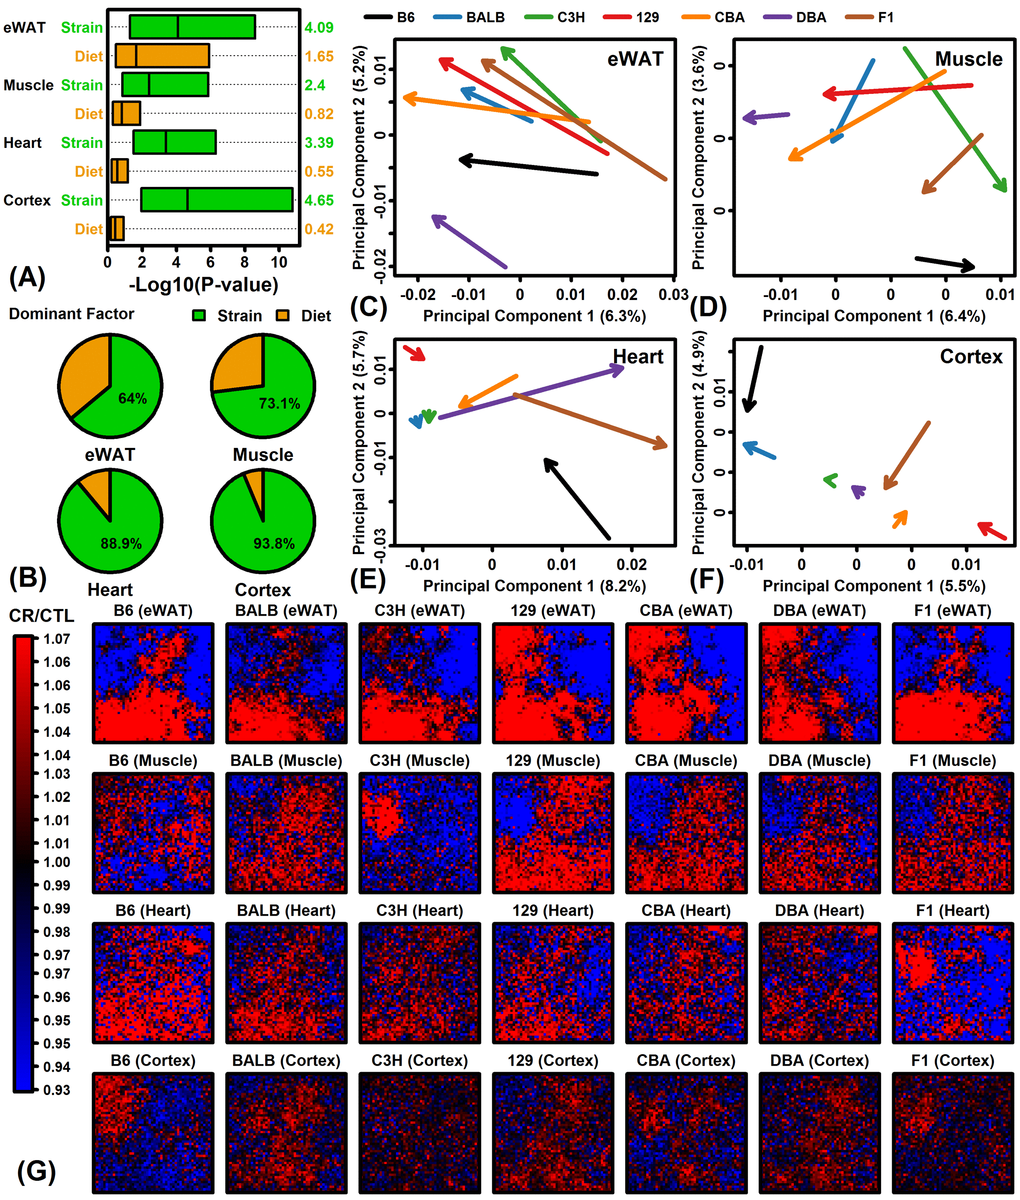
Figure 1.Global transcriptome responses to CR in 4 tissues (eWAT, muscle, heart, cortex) and 7 mouse strains (B6, BALB/c, C3H, 129, CBA, DBA, F1). (A) Relative importance of strain and diet as factors explaining gene expression variation. Linear models were fit with and without diet and strain as explanatory factors. Factor importance (diet or strain) was evaluated based upon –log10-transformed p-values (Log10P) from likelihood ratio tests applied to each gene (horizontal axis). Bars span the middle 50% of Log10P values among genes (right margin: median Log10P). (B) Percentage of genes with strain or diet as dominant explanatory factor. For each gene, the factor yielding the largest Log10P was considered dominant. (C – F) Principal component (PC) response vectors. Arrows begin at the bivariate mean of CTL samples and end at the bivariate mean of CR samples. (G) Self-organizing maps (SOMs). An SOM layout was determined based upon the expression of 13129 genes with detectable expression in all 4 tissues. Heatmaps show the average FC (CR/CTL) for genes assigned to each SOM region.