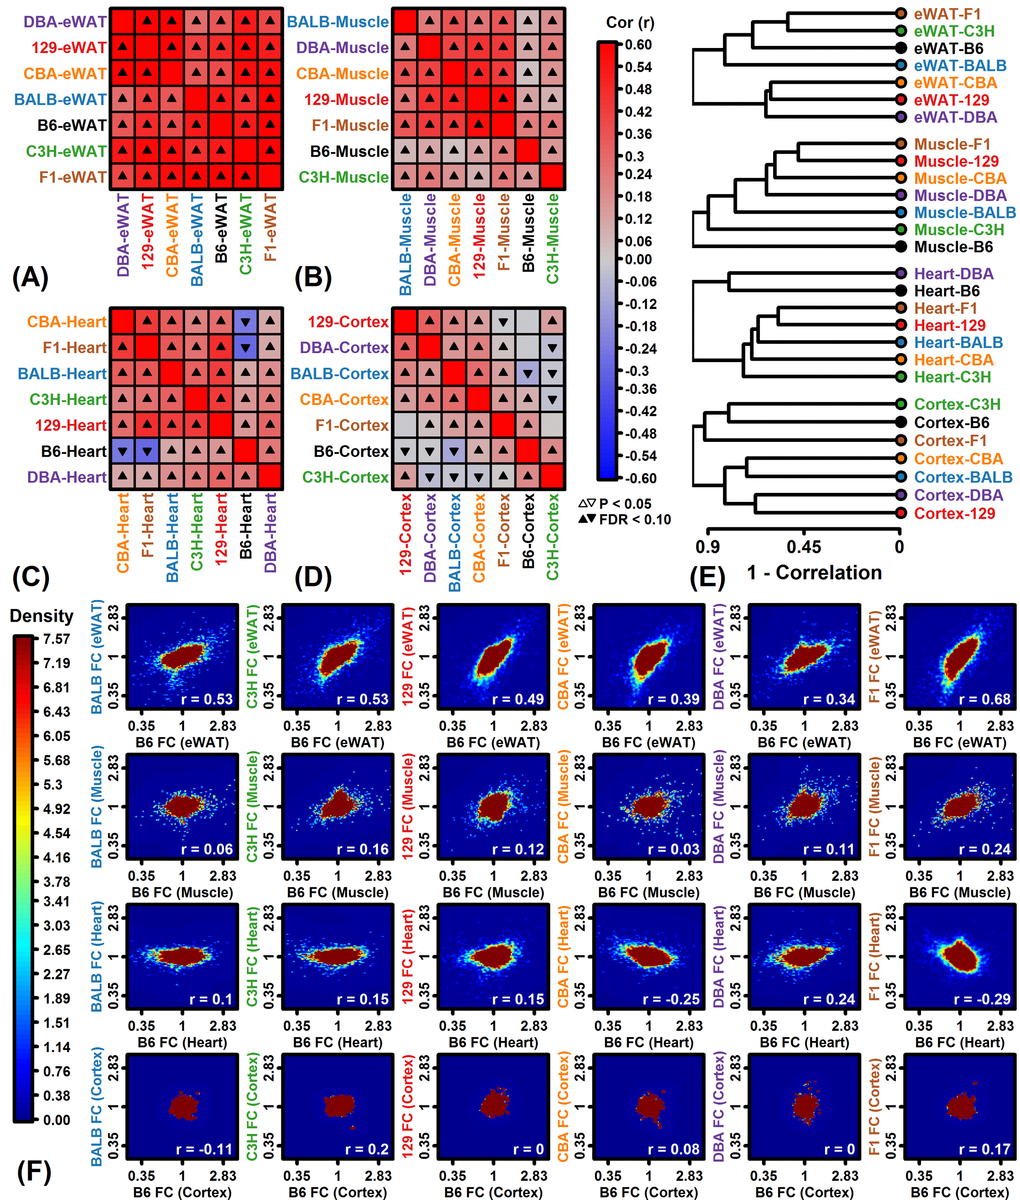
Figure 2.Genome-wide CR response correlation among strains. (A-D) Spearman rank correlation estimates. (E) Hierarchical cluster analysis of strains based upon Spearman correlations among FC estimates. (F) Comparison to B6 mice. Scatterplots compare FC estimates in each strain to those from B6 mice. Colors denote gene density (see scale; lower right: Spearman rank correlation). Analyses in (A) – (F) are based upon all protein-coding genes with detectable expression in a given tissue.