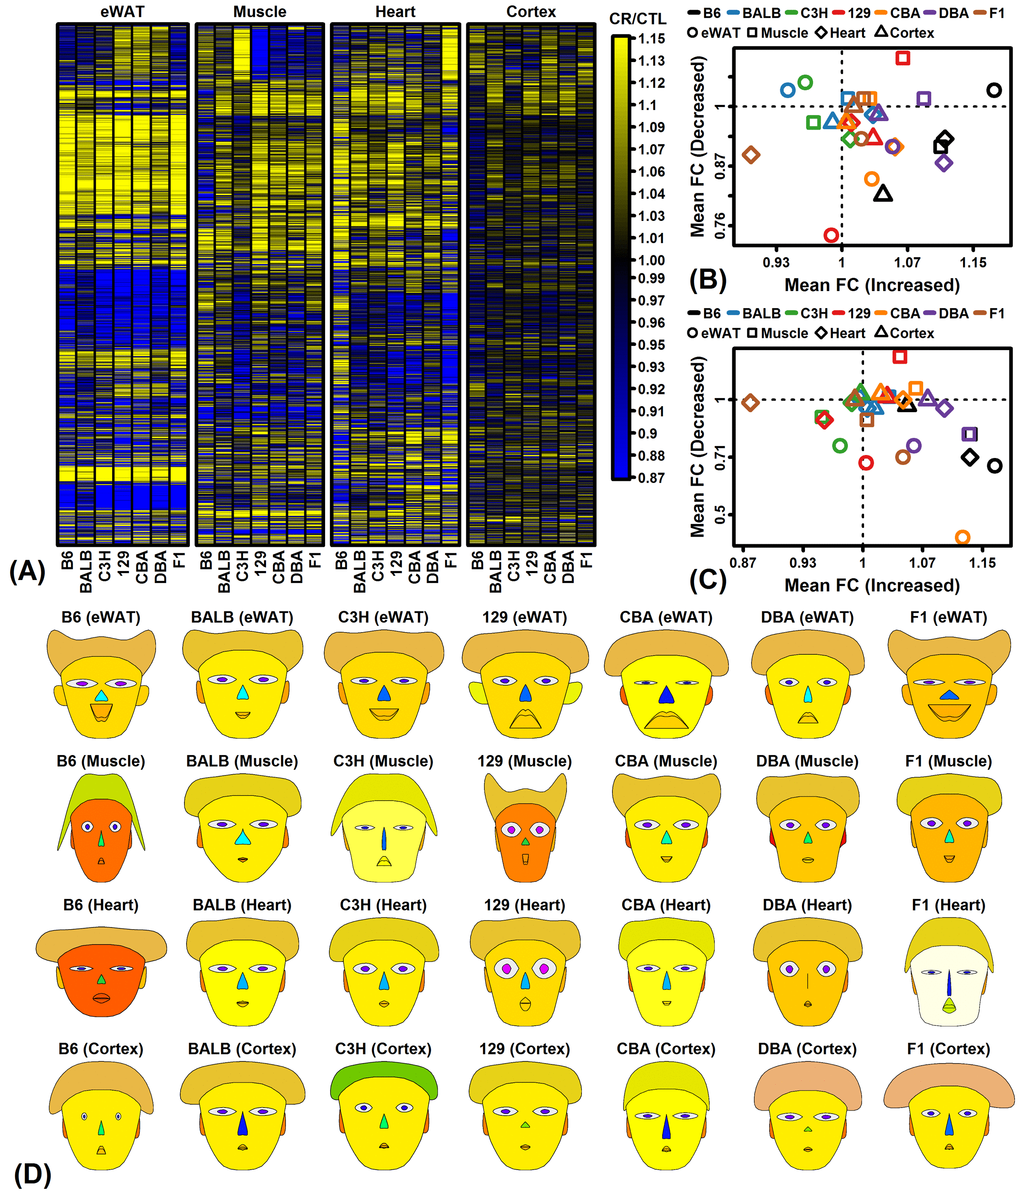
Figure 3.CR response comparison (28 strain-tissue combinations). (A) FC heatmap with hierarchical clustering. The heatmap shows CR responses among 6564 protein-coding genes with detectable expression in all strains and all 4 tissues. Genes were filtered to exclude those weakly altered by CR. Genes were clustered using the average linkage and Euclidean distance. (B) CR meta-analysis gene signature (Plank et al. 2012, Mol Biosyst 8:1339-1349). (C) CR meta-analysis gene signature (Swindell 2009, BMC Genomics 10:585). In (B) and (C), average FC is plotted for CR-increased genes (horizontal axis) and CR-decreased genes (vertical axis) identified from meta-analyses of microarray studies of CR response in rodents. Signatures are calculated from (B) 37 CR-increased and 37 CR-decreased genes or (C) 40 CR-increased and 40 CR-decreased genes. (D) Chernoff faces. A set of 15 principal component (PC) scores was extracted from the matrix of FC estimates for all protein-coding genes and 28 strain-tissue combinations. The Chernoff face features each correspond to one of the 15 PC scores such that more similar faces indicate more similar CR expression responses.