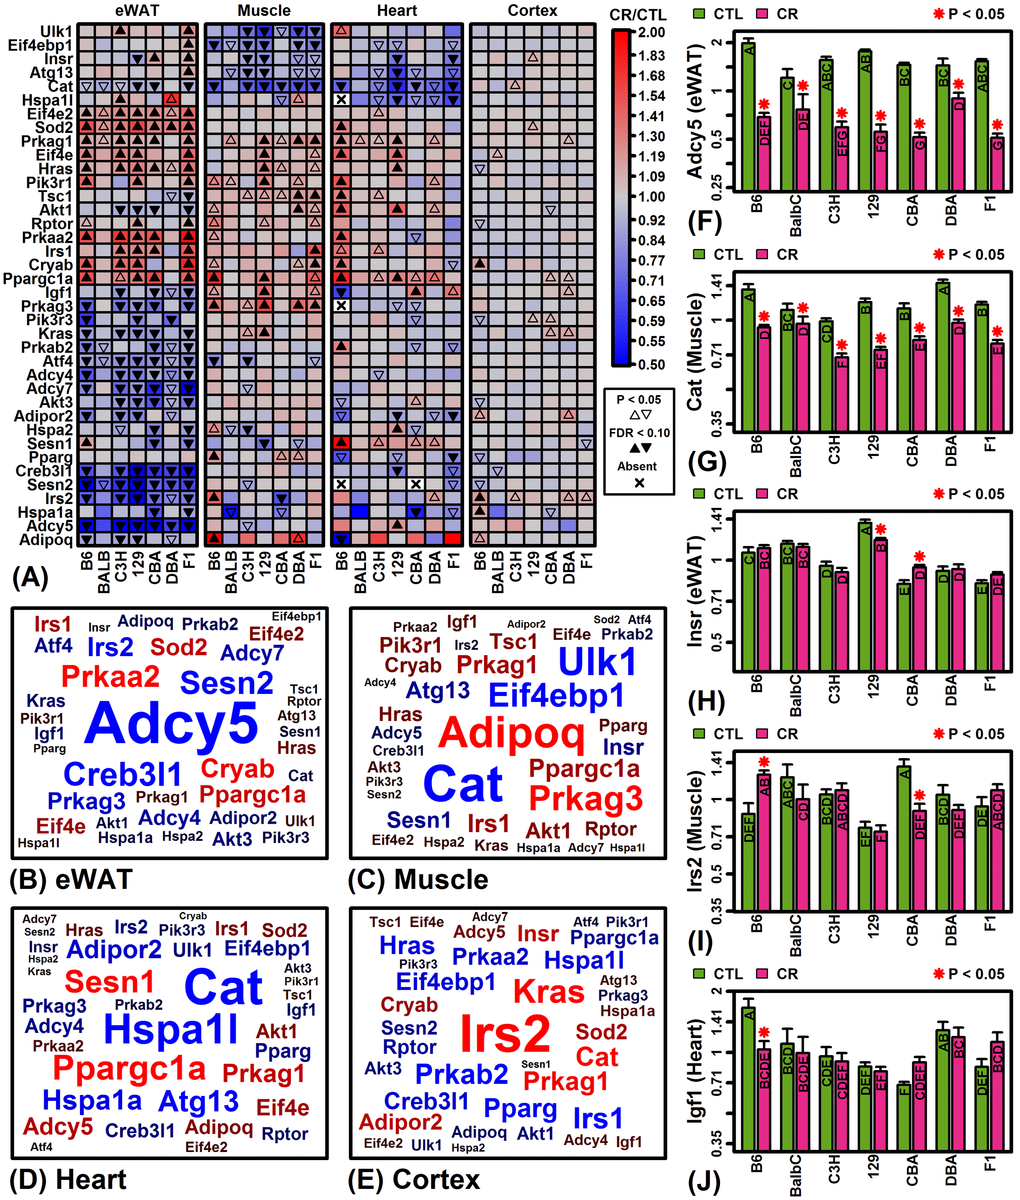
Figure 4.KEGG longevity-regulating pathways (hsa04211 and hsa04213). (A) Selected longevity pathway genes. The top 38 pathway genes were chosen to include those most frequently altered by CR across mouse strains and tissues. (B – E) Gene clouds. The size of gene symbols is proportional the median FC (CT/CTL) observed among strains for the indicated tissue (red: up-regulated; blue: down-regulated). Gene sizes are scaled separately for each tissue and thus not comparable across tissues. (F) adenylate cyclase 5 (Adcy5). (G) catalase (Cat). (H) insulin receptor (Insr). (I) insulin receptor substrate 2 (Irs2). (J) insulin-like growth factor 1 (Igf1). In (F) – (J), asterisks indicate that the CR treatment differs significantly from the CTL treatment for a given strain (P < 0.05). Treatments that share the same letter do not differ significantly (P < 0.05, Fisher’s least significant difference).