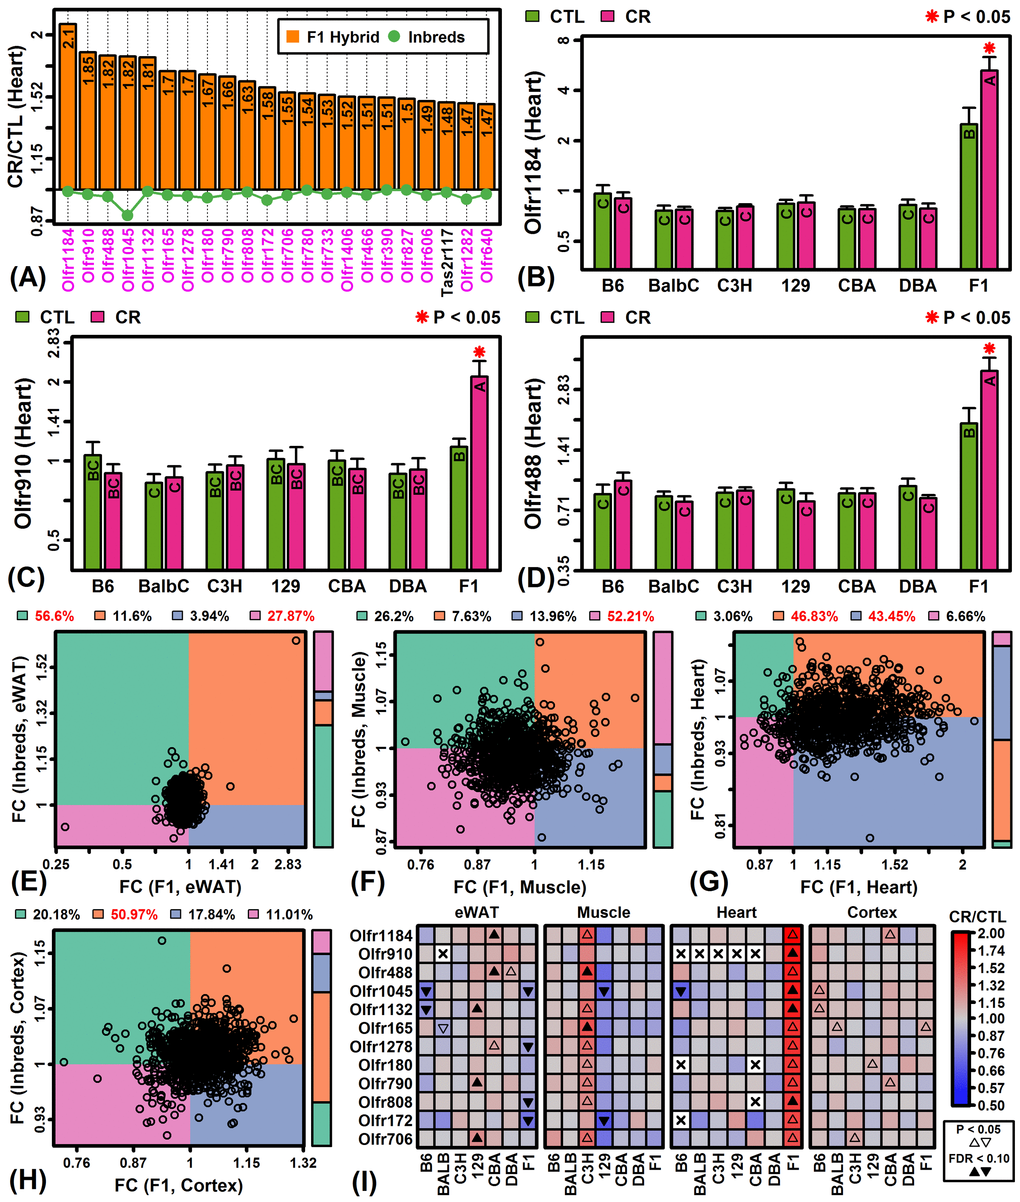
Figure 5.CR specifically increases expression of olfactory receptor genes in F1 mouse heart tissue. (A) Top-ranked genes most specifically increased by CR in heart tissue of F1 mice. Olfactory receptor genes are shown in magenta font (lower margin). The listed genes were significantly elevated in F1 heart tissue (FDR < 0.10; FC > 1.50) with significant strain-by-diet interaction effect (F1 mice vs. other strains; FDR < 0.15). The green line denotes the average FC of the 6 inbred strains. (B, C, D) Olfactory receptors 1184, 910 and 488 (Olfr1184, Olfr910, Olfr488). Asterisks indicate that the CR treatment differs significantly from the CTL treatment for a given strain (P < 0.05). Treatments that share the same letter do not differ significantly (P < 0.05, Fisher’s least significant difference). (E, F, G, H) Olfactory receptor FC scatterplot comparison (F1 vs. inbred mice). Each point represents FC estimates for one olfactory receptor gene (horizontal axis: F1 mice; vertical axis: average FC of inbred mice). The color bar (right) indicates the proportion of genes within each quadrant. The percentage of genes in each quadrant is indicated in the top margin (red: percentage significantly greater than 25%, P < 0.05, Chi-square test). (I) Top-ranked 12 olfactory receptor genes specifically expressed in F1 heart tissue.