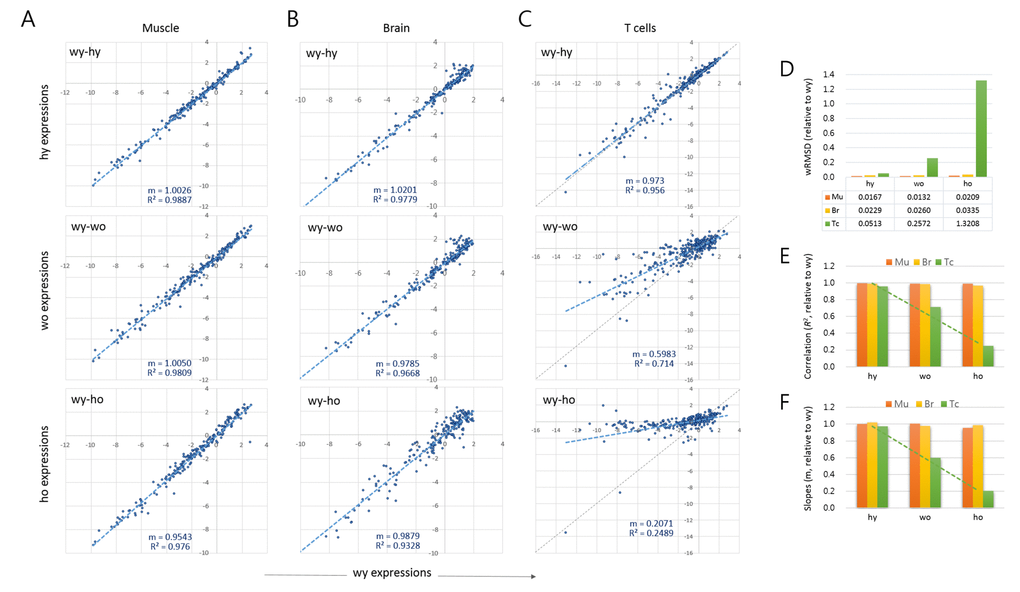
Figure 1.Age-associated changes in quantitative transcriptome structure of splenic T cells. (A-C) Scatter plots comparing the epi-driver gene expression levels between wild-type young (wy) and HD young (hy) samples (wy-hy), between wild-type young (wy) versus wild-type old (wo) samples (wy-wo), and between wild-type young versus HD old (ho) samples (wy-ho) in skeletal muscle (A), brain tissue (B), and splenic CD4+ T cells (C). Blue and gray lines denote a regression curve and the reference slope (m = 1.0), respectively. (D) Weighted root mean square deviation (wRMSD) analysis for assessment of the extent of difference in gene expression level between young and old cells. (E-F) Comparison of the correlations (coefficient of determination, R2; (D) and the slopes (E) of the scatter plots. Mu, muscle; Br, brain; Tc, T cells. Dotted green lines indicate trend lines for T cell samples.