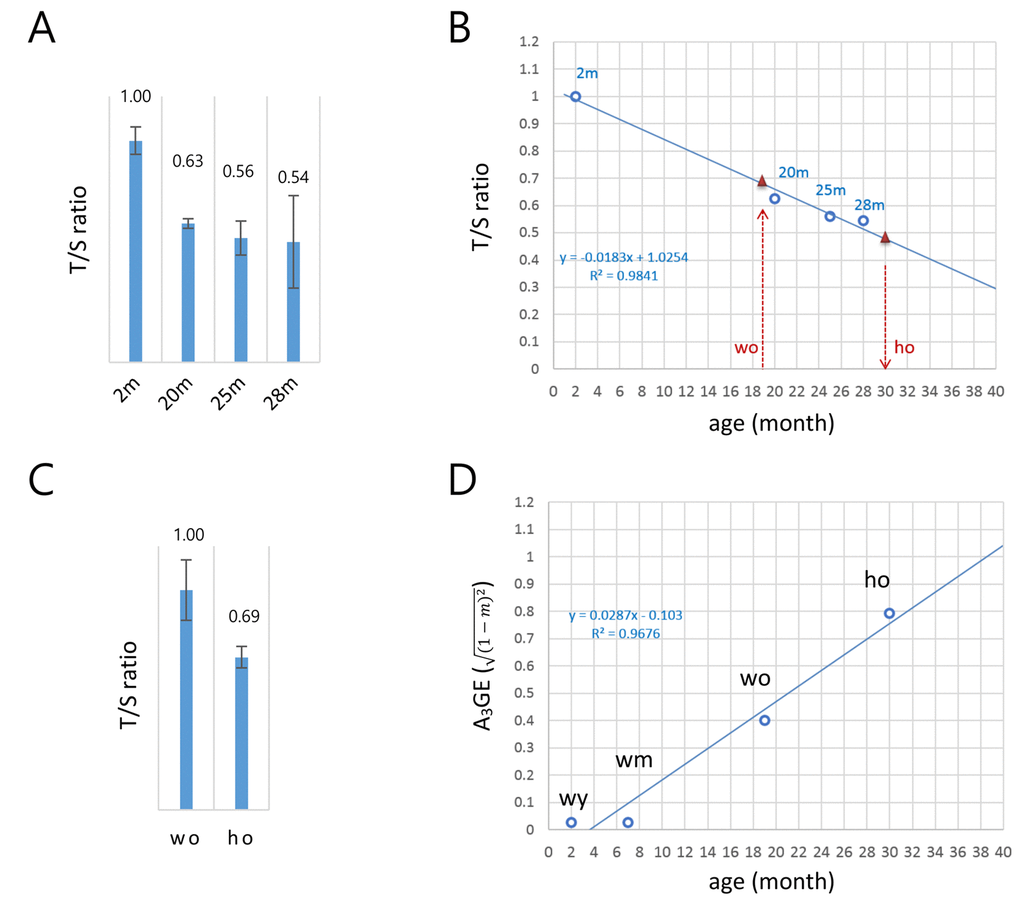
Figure 2.A model for the alteration of gene expression levels as a function of age in T cells. (A) Determination of the copy-number ratio (T/S ratio) of the telomeric sequence to a single-copy gene sequence (S6B4) in splenic CD4+ T cells of wild-type mice with different ages (2, 20, 25, and 28 months). Error bars, standard deviation. (B) Determination of the biological age of the ho T cells. Regression curve (dotted blue line) was derived by the T/S ratios of wild-type T cells in A. The T/S ratio of the 19 month old wo sample corresponds to approximately 0.68 (left red triangle). The relative T/S ratio of the ho T cells was 69% of the wo T/S ratio; the T/S ratio of the ho is 0.47 (0.68 x 0.69), which corresponds to about 30 months of age in wild-type mice (right red triangle). (C) Relative T/S ratio of the old HD (ho) T cells to the old wild-type (wo) T cells. In A and B, quantitative real-time PCR was performed to obtain Ct values for the telomere repeats and S6B4 sequence before calculating the copy-number difference. Error bars, standard deviation. (D) A regression model of the age-associated alteration of gene expression (A3GE defined as ,
where m is a slope) in splenic T cells. A3GE increases at a rate of approximately 2.87% per month on average in wild-type mice.