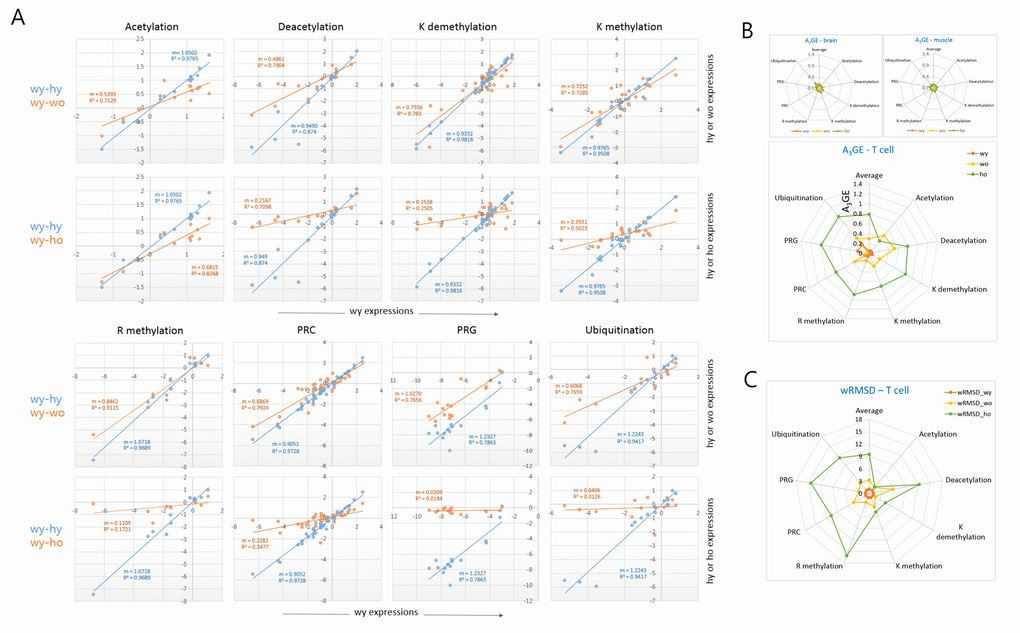
Figure 3.Comparison of A3GE in different epi-driver gene categories between old wild-type and HD T cells. (A) Difference in the extent of A3GE between wo and ho T cells. Two scatter plots which compare expression levels between young (wy-hy) and old (wy-wo; blue) and between young and HD old (wy-ho; orange) are merged. The slope (m) of the regression curve and the correlation value (R2, coefficient of determination) are shown. Each slope represents the extent of A3GE in the corresponding T cells. PRC, Polycomb-repressive complex; PRG, PRC-regulated genes. (B-C) Comparisons of the levels of A3GE (B) and weighted root mean square deviation (wRSMD) (C) in individual gene expression categories in young (wy and hy) and old (wo and ho) T cells. A3GE was minimal in muscle and brain samples which are displayed in the smaller plots. A3GE, age-associated alteration of gene expression.