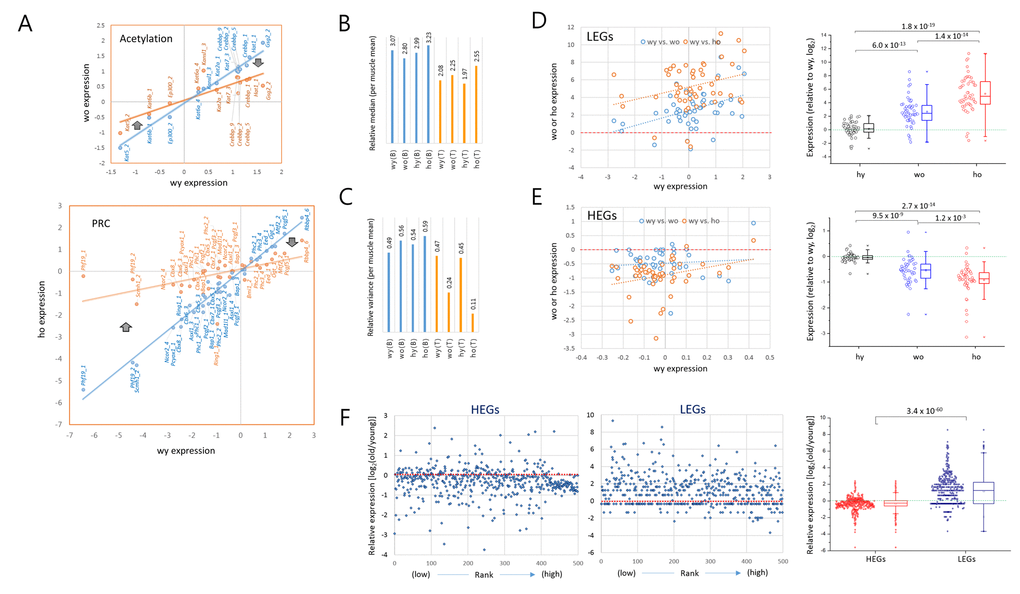
Figure 4.Opposite transcriptional drift of genes with weak and strong transcriptional strengths. (A) Representative pattern of an age-related expression changes in the acetylation (upper) and PRC (Polycomb repressive complex; lower) category genes. The expression levels of individual epi-driver genes in young T cells (blue) are paired with corresponding genes in old T cells (orange). The thick arrows denote the direction of expression-level change in low expressing genes (left) and high expressing genes (right) with age. (B-C) Measurement of the median (B) and variance (C) of gene expression levels in the brain (B) and T cells (T) relative to those in the muscle samples. (D-E) Opposite directions of age-associated alteration of gene expression (A3GE) between the lowly (LEGs, n = 50; D) and highly expressed genes (HEGs, n = 50); (E). Two scatter plots compare expression levels between young (wy-hy) and old (wy-wo; blue) and between young and HD old (wy-ho; orange) are merged. Box plots on the right show the opposing directions of change and also the statistical significance of the A3GE differences between the samples. (F) A3GE in the transcriptomes of CD4+ T cells. RNA-seq was performed using mRNAs of MACS-purified splenic CD4+ T cells pooled from three different mice of two or 20 months of age. Five hundred top and 500 bottom ranked genes were selected, HEGs (FPKM values ranging from 144.1 to 7,444.7) and LEGs (from 0.0041 - 0.035) respectively, after transcriptomes were sorted by expression level for FPKM levels of young T cells. Expression levels of old wild-type T cells relative to young were calculated using a log2 scale. P-values in D-F, paired sample t-test.