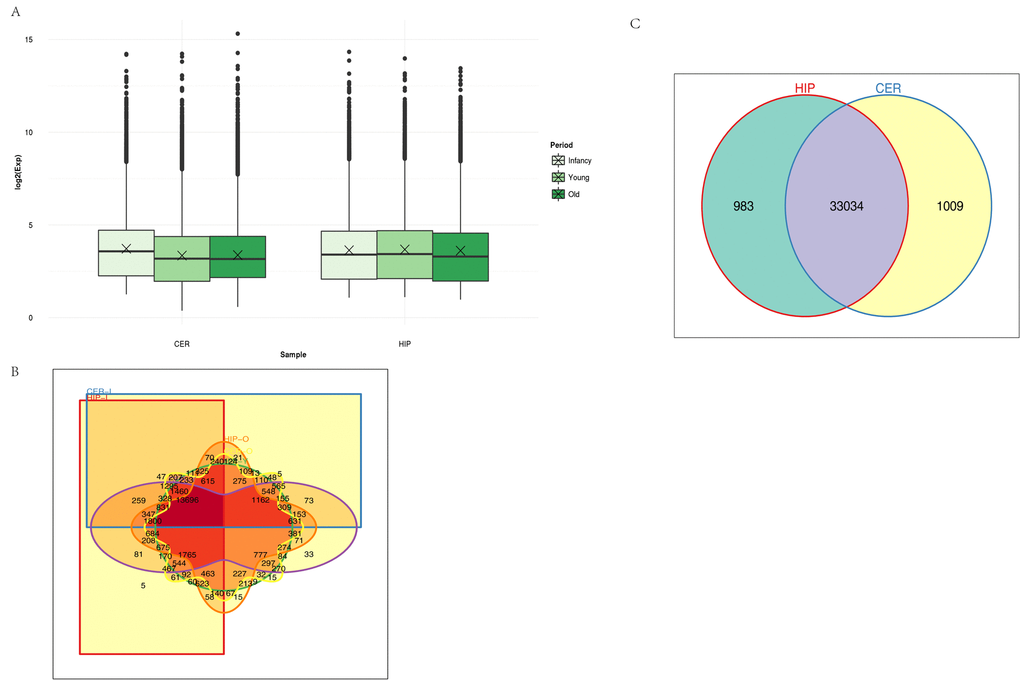
Figure 2.Characteristics of circRNA expression. (A) Box plots comparing circRNAs measured based on the log of the expression level (base 2) in the two brain regions over time. CER: cerebellum, HIP: hippocampus. (B) Venn diagram showing the overlapping circRNAs identified in the hippocampus and cerebellum. (C) Venn diagram showing the overlapping circRNAs detected in different brain regions over time. Different colors and shapes represent different brain regions and time points. HIP-I, HIP-Y, and HIP-O represent the three ages in the hippocampus. CER-I, CER-Y, and CER-O represent the three ages in the cerebellum.