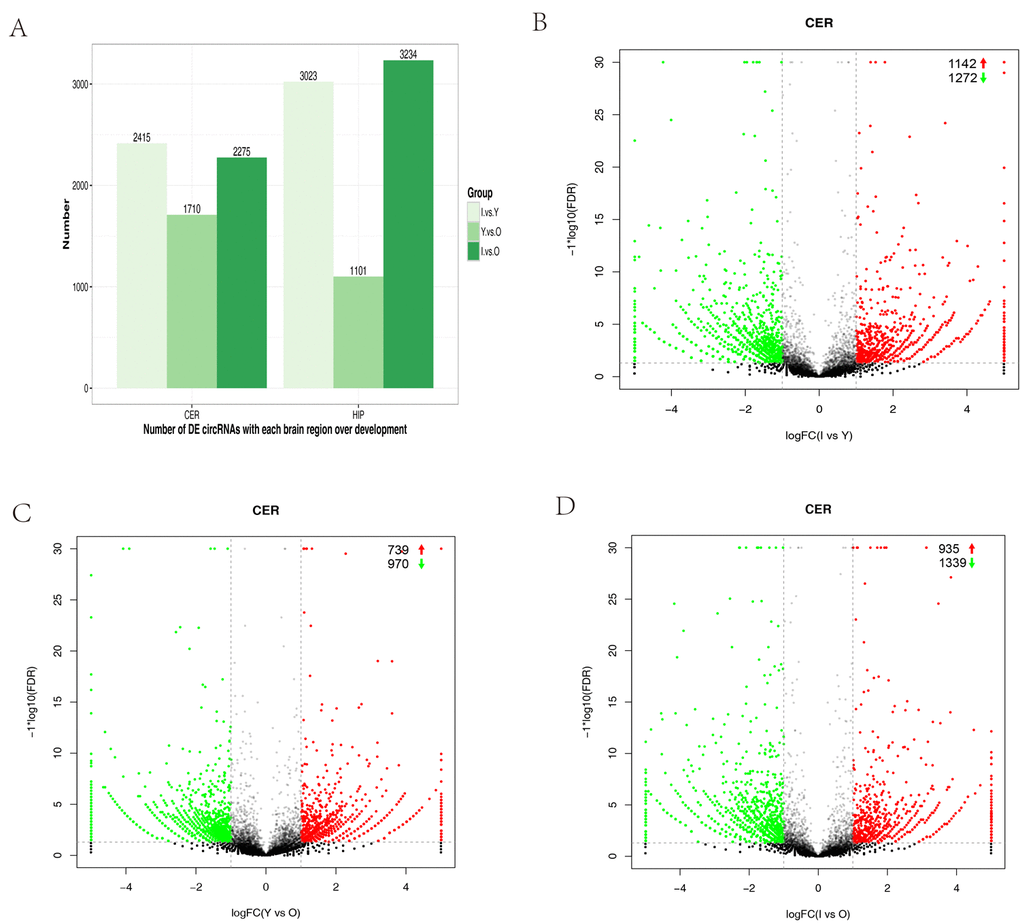
Figure 3.Differential circRNA expression in the cerebellum with aging. (A) Bar plot representation of differentially expressed circRNAs in different age groups. (B–G) Volcano plots showing the dysregulated circRNAs in the cerebellum in different age groups. The log of FC (base 2) is plotted on the x-axis and the negative log of FDR (base 10) is plotted on the y-axis (FC >2 and p < 0.05). The green and red points on the graph represent downregulated and upregulated circRNAs, respectively.