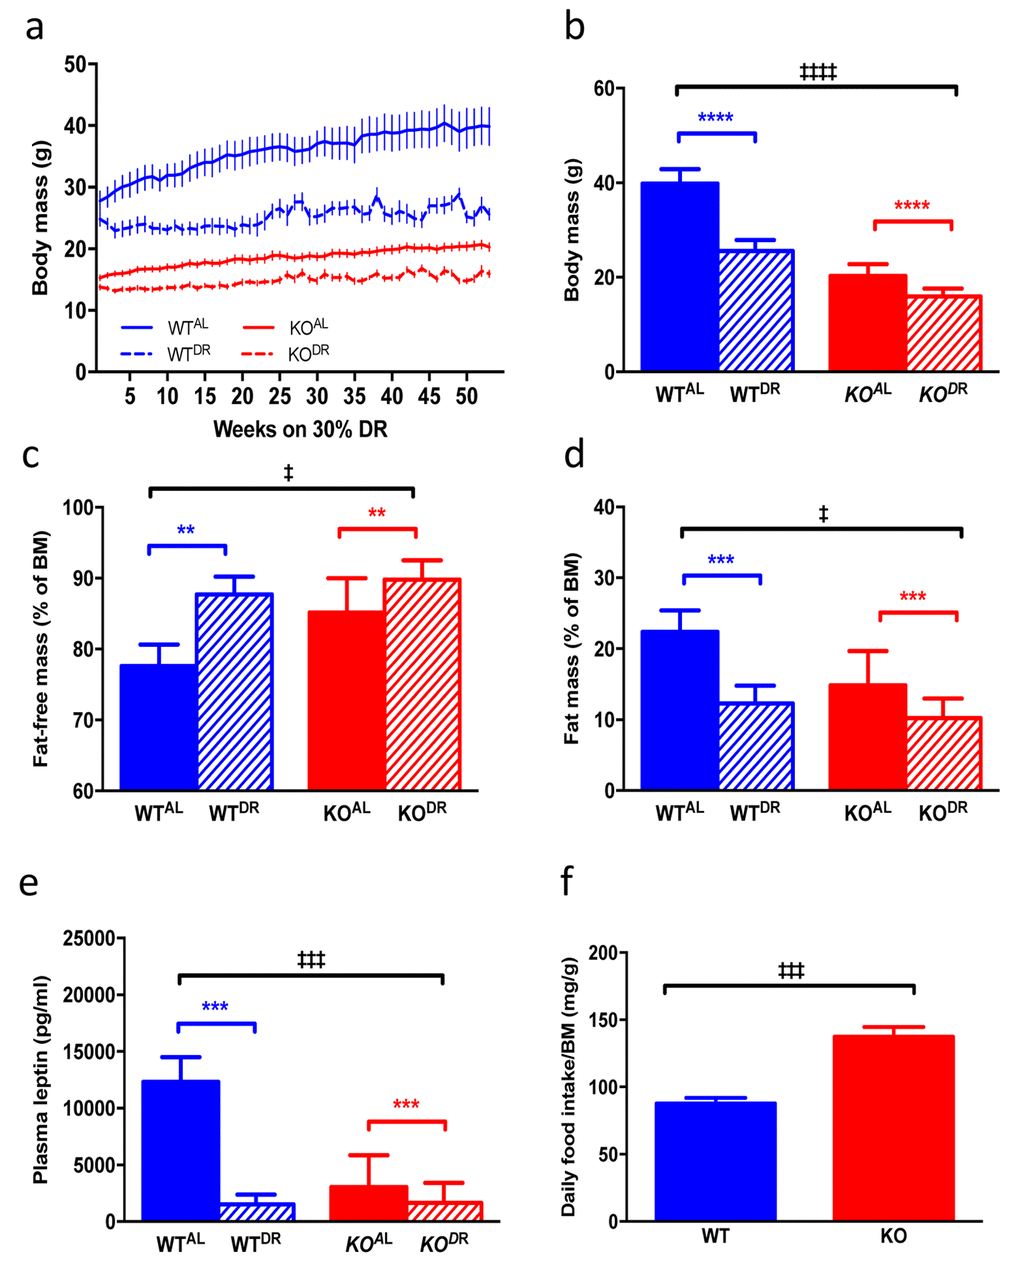
Figure 7.Body mass and adipose physiology of WT and KO mice on AL and DR diets. (a) Raw body mass measurements of WTAL, WTDR, KOAL, KODR for 52 weeks once DR mice reached 30% DR. (b) Body mass of mice at final time point of 52 weeks. (c) Fat-free mass (% of body mass) of mice at 12 months of DR. (d) Fat mass (% of body mass) of mice at 12 months of DR. (e) Plasma leptin levels in mice at 12 months of DR. (f) Daily food intake (corrected for body mass) of mice fed AL diets. WTAL, n = 8; WTDR, n = 6; KOAL, n = 14; KODR, n = 10. Error bars represent mean ± SEM. * represents significant effect of treatment and ‡ represents significant effect of genotype. **/‡‡ p < 0.01, ***/‡‡‡ p < 0.001. For a blue lines represent WT mice and red lines represent KO mice; solid lines represent mice fed an AL diet and dashed lines represent mice fed a DR diet. For b-e blue bars are WT mice and red bars are KO mice, solid bars represent AL diet and hatched bars represent DR diet.