


Introduction
Multiple studies have now demonstrated that aging in a variety of animal species can be modulated through dietary, genetic and pharmacological means [1–3]. For example, it has been established since the early 20th century that dietary restriction (DR), defined here as reductions in energy intake, reductions in specific macro or micronutrients or intermittent fasting in the absence of malnutrition, extends lifespan across many taxa [1,4–8]. In addition, DR also improves late-life health (healthspan) in a range of organisms [1,5,9,10]. Similarly, genetic modulation of a number of signalling pathways, most notably the nutrient sensing insulin/insulin-like growth factor (IIS) and mechanistic target of rapamycin (mTOR) pathways, extends both lifespan and healthspan in model organisms [11–17], and genetic polymorphisms within these same pathways correlate with longevity in humans [18,19].
Despite the considerable research effort that has been undertaken in identifying interventions that extend lifespan and healthspan, precisely how particular interventions act to elicit their beneficial effects is still uncertain, although many putative mechanisms have been proposed [20]. Similarly, it is unclear as to whether different interventions induce their beneficial effects through shared or distinct mechanisms [8]. In an attempt to better understand whether commonality (or lack thereof) exists in putative mechanisms between long-lived models, studies examining the impact of interventions such as DR on a range of parameters such as lifespan, metabolism and transcription have been undertaken in long-lived genetic mutants. In Drosophila, the loss of Chico, the single Drosophila insulin receptor substrate (IRS) protein, increases lifespan [12] but DR in these mutants does not confer any additional increase of lifespan [21], suggesting that both interventions may act through overlapping mechanisms to extend lifespan. In contrast, the longevity of C. elegans IIS mutants, but not DR mutants, appears to be dependent on the activity of the FOXO transcription factor DAF-16 [22], with eat-2:Daf-2 double mutants living longer than Daf-2 mutants [23]. Similar findings have been observed using other models of DR (e.g [24].) suggesting that within C. elegans at least those mechanisms underlying DR-induced longevity appear distinct to those extending lifespan in IIS mutants. However, it should be noted that IIS may also underlie a particular response to DR [25], and that the DR protocols employed may impact on the interactions observed [26].
In rodents, there is a much more limited literature investigating the overlap between DR and long-lived genetic mutants, although many phenotypic similarities exist between DR mice and genetic models of longevity. For example, in Ames mice, DR did not lower plasma insulin or glucose levels, and unlike in wild-type (WT) control mice, loss of body mass (BM) following 30% DR was much less dramatic in Ames dwarfs [27]. However, DR had an additive effect on lifespan in both long-lived Ames dwarf mice [28] and in growth hormone releasing hormone (GHRH) knockout mice [29], suggesting that these mutants are not simply DR mimetics. However, interestingly the additive effect of DR on Ames longevity was apparent only on a mixed genetic background, and not on a C57BL/6 background [30]. In contrast, neither 30% DR [31] nor every-other-day feeding [32] affected longevity in growth hormone receptor (GH) binding protein knockout mouse (GHRKO), potentially through the inability of DR to further improve insulin sensitivity in already highly insulin sensitive animals. In long-lived adenylyl cyclase type 5 knockout mice (AC5KO), 40% DR induced mortality within one month, despite DR significantly reducing fasting glucose levels and increasing insulin sensitivity in these mutants [33]. While significant commonality appears to exist between the transcriptional profiles of DR mice and certain long-lived mutants [14,33,34], little overlap was observed in plasma metabolites identified in a comparative metabonomic study of DR mice, insulin receptor substrate 1 null (Irs1-/-) mice and Ames dwarf mice [35].
We have previously reported that both male and female Irs1-/- mice are long lived and have a greater period of their life free from age-related pathologies compared to WT controls [13,36]. However, in contrast to several other long-lived mouse mutants, Irs1-/- mice are glucose intolerant and hyperinsulinaemic when young [13], and do not exhibit enhanced cellular (fibroblast or myoblast) stress resistance [37]. In the following study we maintained WT and Irs1-/- (KO) mice on an ad libitum (AL) or 30% DR for 12 months (DR initiated at 3 months of age) to generate 4 experimental groups (WTAL, WTDR, KOAL and KODR). We then employed an RNAseq approach in order to identify common and unique transcriptional signatures within liver, skeletal muscle, brain and inguinal white adipose tissue (WAT) from WTDR and KOAL mice, relative to WTAL controls. We then went on to determine how DR affects transcriptional profiles of Irs1-/- (KODR) mice. In addition, we measured a suite of phenotypic parameters including body mass, body composition and glucose homeostasis, in order to determine whether DR induced additive effects on these parameters in Irs1-/- mice.
Results
Tissue-specific transcriptional profiles within KOAL mice
From the significantly up/down differentially expressed genes (as determined by Cuffdiff [38] with FDR < 10%), we first employed a four-way Venn analysis to examine overlap at the single gene level across liver, skeletal muscle, brain and WAT tissues within KOAL mice at 15 months of age. In general, few genes showed commonality across tissues. No single gene was differentially expressed within KOAL mice across all four tissues (Fig. 1a and Table S1), although five genes encoding the ribosomal proteins Rpl37a, Rps26, Rpl31 and the haemoglobin proteins Hba-a1 and Hbb-bt were up-regulated in common across liver, skeletal muscle and brain. The greatest transcriptional overlap was observed between skeletal muscle and WAT; eight common genes were up-regulated including genes involved in fatty acid metabolism and thyroid hormone regulation such as Elovl6 and Thrsp, and Lmod1, and 15 common genes were down-regulated including those involved in inflammation and angiogenesis such as Serpina3n, Serpina3c, Thbs2, and Mest/Peg1. The next largest overlap in terms of common genes was between liver and skeletal muscle, with 12 genes up-regulated including those involved in oxygen transport and cell cycle exit, such as Hba-a2, Hbb-bs and Cdkn1a. We further annotated the biological function from the enriched set of up- (Fig. 1b and Table S2) or down-regulated (Fig. 1c and Table S3) genes within our KOAL mice by generating Gene Ontology (GO; both Biological Processes and Molecular Functions) categories. Within the liver, significant GO terms in the up-regulated category included structural constituents of the ribosome, positive regulation of B cell proliferation, haptoglobin binding and fatty acid derivative metabolic/catabolic processes, whereas in the down-regulated category significant GO terms included negative regulation of RNA metabolic processes. Within skeletal muscle, structural constituents of ribosome and haptoglobin binding were again over-represented in the up-regulated gene category along with several GO terms linked to mitochondrial processes, including oxidoreductase activity, electron carrier activity and cytochrome-c oxidase activity. In the down-regulated category, several GO terms linked with inflammatory processes, including response to leucocyte proliferation, response to interferon-gamma and serine-type endopeptidase inhibitory activity were over-represented. Within the brain, in common with liver and muscle the GO categories structural constituents of ribosome, haptoglobin binding and peroxidase activity were identified, alongside those for regulation of adenylate cyclase activity and G-protein coupled receptor signalling were overrepresented in the up-regulated genes. GO categories for anatomical structure formation involved in morphogenesis and angiogenesis were overrepresented within the down-regulated genes in brain. GO terms in WAT linked to muscle contraction, striated muscle cell differentiation and myofibril assembly were identified in the up-regulated gene category, while terms including heparin binding, inflammatory response and wound healing were identified within the down-regulated gene set.
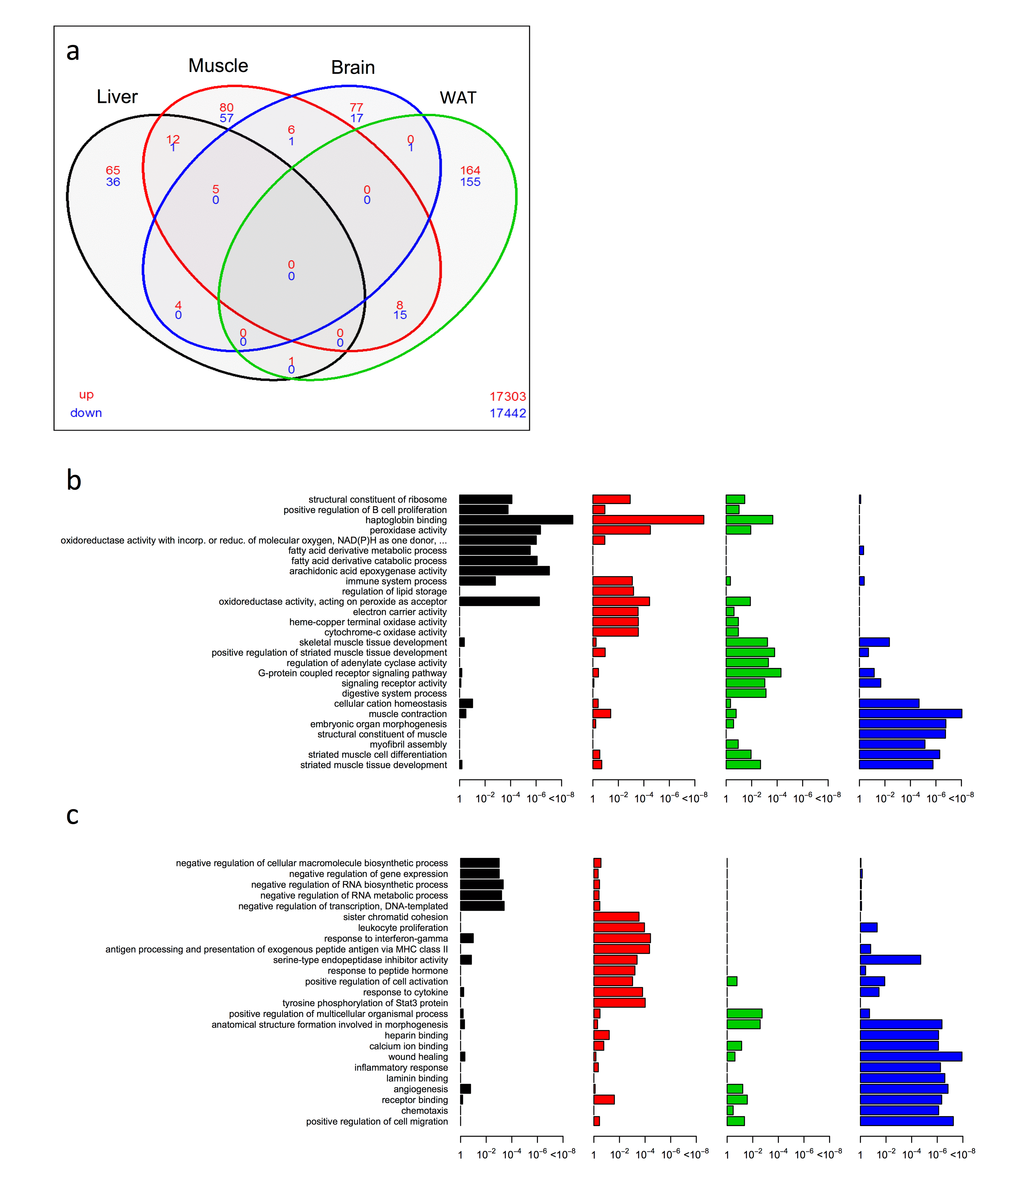
Figure 1. Shared and distinct gene expression profile among four tissues in KOAL mice. (a) Venn diagram of similar expressed genes across liver, skeletal muscle, brain and WAT tissue in KOAL mice. Significantly up-regulated genes are shown in red and significantly down-regulated genes are shown in blue. Common genes that are significantly up- or down-regulated are found in overlapping ovals. The numbers in the bottom far right denotes the number of genes expressed but not significantly up-regulated (red) or down-regulated (blue). (b) Up-regulated gene ontology (GO) terms in liver, skeletal muscle, brain and WAT of KOAL mice versus WTAL mice. (c) Down-regulated GO terms in liver, skeletal muscle, brain and WAT of KOAL mice.
Tissue-specific transcriptional profiles within WTDR mice
In WTDR, we noted far less overlap of significantly differentially expressed genes between tissues in a four-way Venn analysis than was observed in the KOAL mice (Fig. 2a and Table S4). Only one single gene, Sfrp5, which encodes secreted frizzled related protein 5 and is involved in Wnt signalling, showed commonality across three tissues, being down-regulated in skeletal muscle, brain and WAT. Similar to the KOAL mice, the greatest number of overlapping genes was between muscle and WAT, and we noted again the up-regulation of Elovl6. Common down-regulated genes in muscle and WAT included several involved in cell adhesion and remodelling such as Prelp, Mrc2, Nedd9, and Sorbs2. The second largest number of overlapping genes was between liver and muscle; of the five genes that were up-regulated several were associated with ribosome structure and function including Rpl31, Rps27l, and Rp23 and of one of the three genes down-regulated was Cidec which encodes a protein involved in lipid storage. Again exploiting a GO classification approach, we identified both overlapping and distinct tissue-specific profiles in WTDR mice (Fig. 2b, c and Table S5, Table S6). In liver, the most significant GO terms in the up-regulated category were associated with ribosomal small subunit biogenesis, structural constituents of ribosome and glutathione binding, whilst in the down-regulated category set significant GO terms included neutral lipid catabolic process and innate immune response. In muscle, GO terms associated with structural constituents of ribosome, cellular lipid metabolic process and positive regulation of cholesterol esterification were identified in the up-regulated category, with GO terms to actin binding, reactive oxygen species metabolic process and several associated with inflammation identified in the down-regulated category. Within the up-regulated category in the brain, GO terms included positive regulation of macromolecule biosynthetic process, behaviour and learning and memory, whereas phenol-containing compound biosynthetic process and catecholamine biosynthetic process were identified in the down-regulated category. Finally, within WAT of WTDR mice, the GO terms acetyl-CoA metabolic process and carboxylic acid metabolic process were identified in the up-regulated, and collagen binding and growth identified in the down-regulated categories.
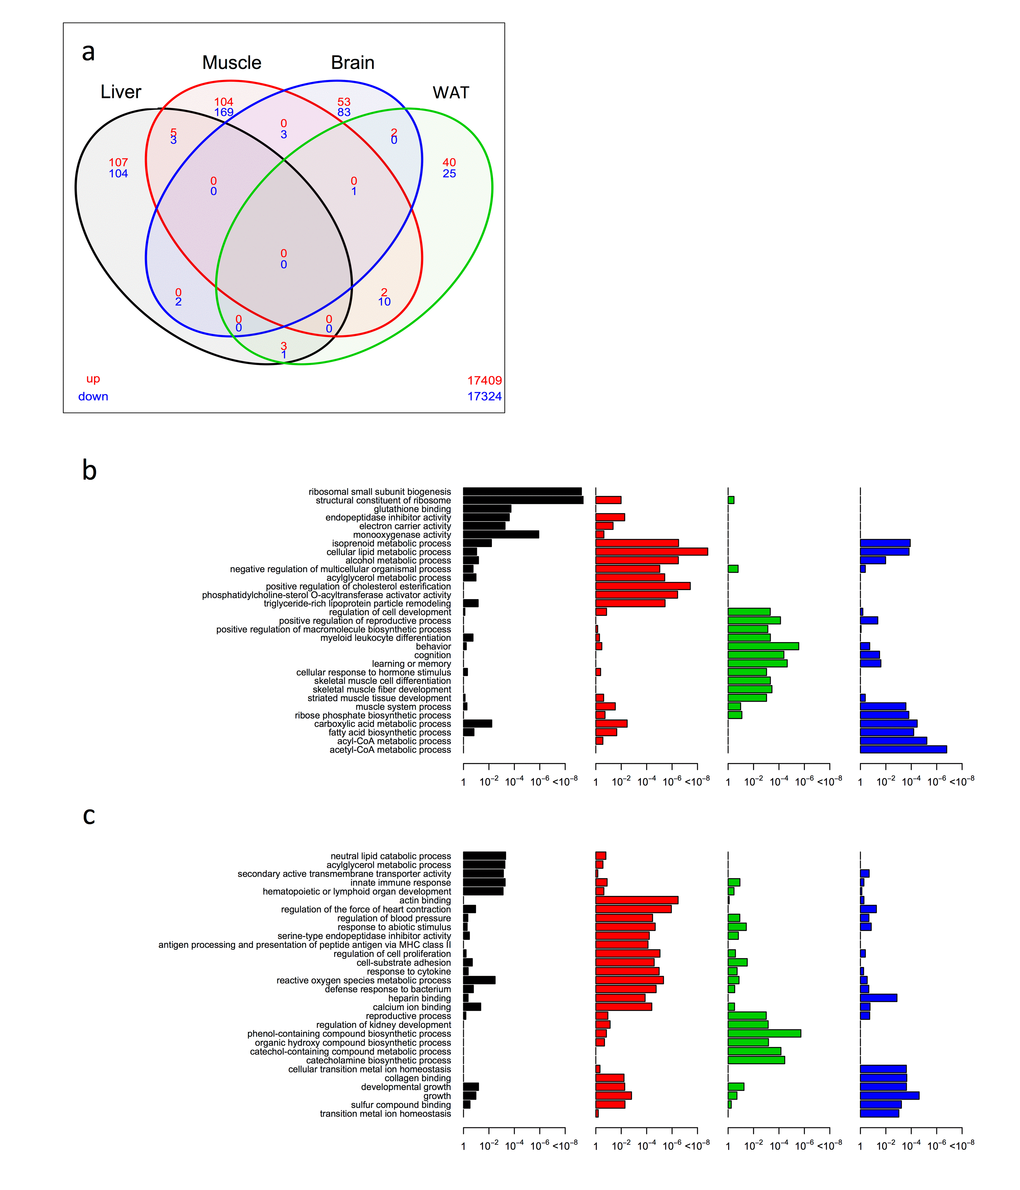
Figure 2. Shared and distinct gene expression profile among four tissues in WTDR mice. (a) Venn diagram of similar expressed genes across liver, skeletal muscle, brain and WAT tissue in KOAL mice. Significantly up-regulated genes are shown in red and significantly down-regulated genes are shown in blue. Common genes that are significantly up- or down-regulated are found in overlapping ovals. The numbers in the bottom far right denotes the number of genes expressed but not significantly up-regulated (red) or down-regulated (blue). (b) Up-regulated gene ontology (GO) terms in liver, skeletal muscle, brain and WAT of KOAL mice. (c) Down-regulated GO terms in liver, skeletal muscle, brain and WAT of KOAL mice.
Transcriptional overlap between KOAL and WTDR mice
We next investigated the number of common and distinct genes significantly differentially expressed between KOAL and WTDR mice, which are summarised by a heatmap of the tissue-specific response in KOAL mice and in WTDR mice, both relative to WTAL mice (Fig. 3; based on the average log2 difference between each of the conditions reported). A total of 1172 genes were significantly differentially expressed (FDR-adjusted p value < 10%) in at least one model and in one tissue. The number of common and distinct genes significantly differentially expressed (q<0.1) between KOAL and WTDR mice are summarised using individual Venn diagrams for liver, skeletal muscle, brain and WAT (Fig. 4a-d; with the numbers in the bottom far right of each Venn diagram denoting the number of genes expressed but not significantly up-regulated (red) or down-regulated (blue) by either condition. For all tissues, there was highly significant overlap between KOAL and WTDR mice using the Fisher exact test in both up-regulated (red) and down-regulated (blue) genes. More transcriptional overlap in terms of number of genes significantly altered was observed between KOAL mice and WTDR mice in skeletal muscle (42 up/44 down), than in brain (31/10), WAT (11/26) or liver (24/12). In all tissues there were more genes that were unique to KOAL or WTDR mice than genes that showed commonality across both models (Fig. 4). In KOAL mice the number of genes differentially expressed for each tissue were as follows; brain (92 up/19 down), liver (87/37), muscle (111/74) and WAT (173/171). In WTDR mice, the number of genes differentially expressed within each tissue was as follows; brain (55/89), liver (115/110), muscle (111/186) and WAT (47/37) (Fig. 4a-d and Table S7).
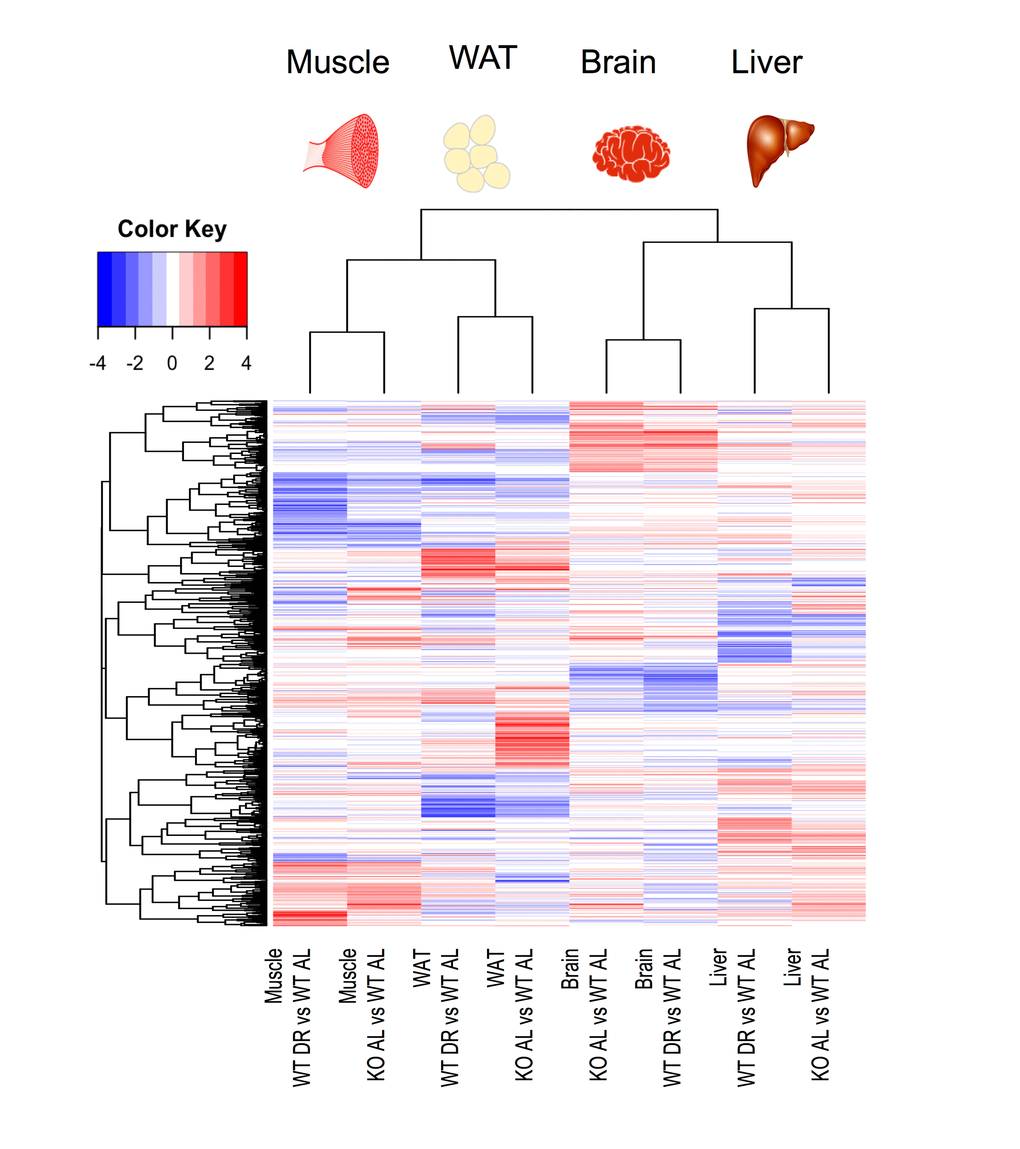
Figure 3. Heat map of significantly differentially expressed genes in liver, skeletal muscle, brain and WAT from either KOAL or WTDR mice compared to WTAL. A total of 1172 genes were significantly differentially expressed. Red represents up-regulated genes and blue represents down-regulated genes.
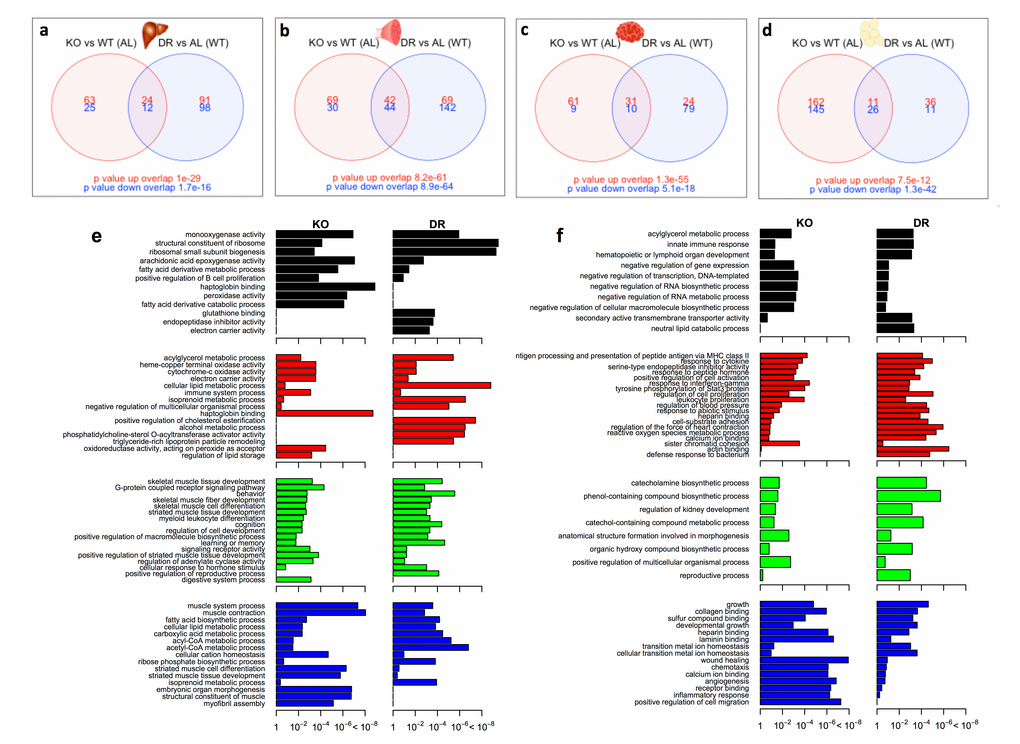
Figure 4. Shared and distinct gene expression profile between KOAL and WTDR mice. Venn diagram of similar and separate expressed genes across (a) liver, (b) skeletal muscle, (c) brain and (d) WAT. Significantly up-regulated genes are shown in red and significantly down-regulated genes are shown in blue. Common genes that are significantly up- or down-regulated are found in overlapping circles. The numbers in the bottom far right denotes the number of genes expressed but not significantly up-regulated (red) or down-regulated (blue). (e) Up-regulated gene ontology (GO) terms in liver (black), skeletal muscle (red), brain (green) and WAT (blue) shared between KOAL and WTDR mice. (f) Down- regulated GO terms in liver, skeletal muscle, brain and WAT shared between KOAL and WTDR mice.
We then identified common GO terms within the up-regulated (Fig. 4e) and down-regulated (Fig. 4f) categories from KOAL and WTDR mice. Within the up-regulated sets, common GO terms in liver of KOAL and WTDR mice included monooxygenase activity, structural constituents of ribosome and arachidonic acid epoxygenase activity (Fig. 4e). In skeletal muscle, common GO terms included acylglycerol metabolic process and several associated with mitochondrial function (Fig. 4e). Significant and common GO terms from the up-regulated sets in brains of KOAL and WTDR mice included skeletal muscle tissue development, G-protein coupled receptor signalling, commitment of neuronal cell to specific neuron type in forebrain and cognition (Fig. 4e), while in WAT, common GO terms included skeletal muscle tissue development, G-protein coupled receptor signalling and myeloid leucocyte differentiation (Fig. 4e).
In liver, significant GO terms shared across the down-regulated sets across KOAL and WTDR mice included acylglycerol metabolic process, innate immune response and negative regulation of RNA biosynthetic process (Fig. 4f). Within skeletal muscle, many significant and overlapping GO terms were associated with inflammation including response to cytokine and antigen processing and presentation of peptide antigen via MHC class II, while overlapping GO terms in the brain included catecholamine biosynthetic process and anatomical structure formation in morphogenesis. Finally in WAT, overlapping GO categories between KOAL and WTDR included WAT growth, collagen binding and wound healing (Fig. 4f).
Transcriptional impact of long-term 30% DR in IRS1 KO mice
A three-way Venn analysis was used to explore common and unique gene expression across KOAL, WTDR and KODR mice (Fig. 5a-d). No genes were identified that were shared in common across KOAL, WTDR and KODR mice in liver, brain or WAT. However, four common genes were up-regulated in skeletal muscle (Fig. 5c); the ribosomal genes Rpl17, Rps26 and Rpl31, and Thrsp which is involved in fatty acid metabolism. In general, the overall transcriptional profile following DR in KO mice (KODR) did not overlap with either the signature seen in KOAL or WTDR mice. Furthermore, using a GO approach we found that many of the shared GO categories identified between KOAL or WTDR were not observed in KODR mice (Fig. S1a-h), which revealed an induction of a unique set of genes. This was particularly noticeable in the skeletal muscle and brain, where many more genes were differentially regulated in KODR mice than in either KOAL or WTDR mice. In the brain, for example 1124 genes were uniquely and significantly differentially regulated in KODR mice, compared to only 68 and 103 in KOAL or WTDR mice respectively. In contrast, only 20 genes were differentially regulated in the WAT of KODR mice.
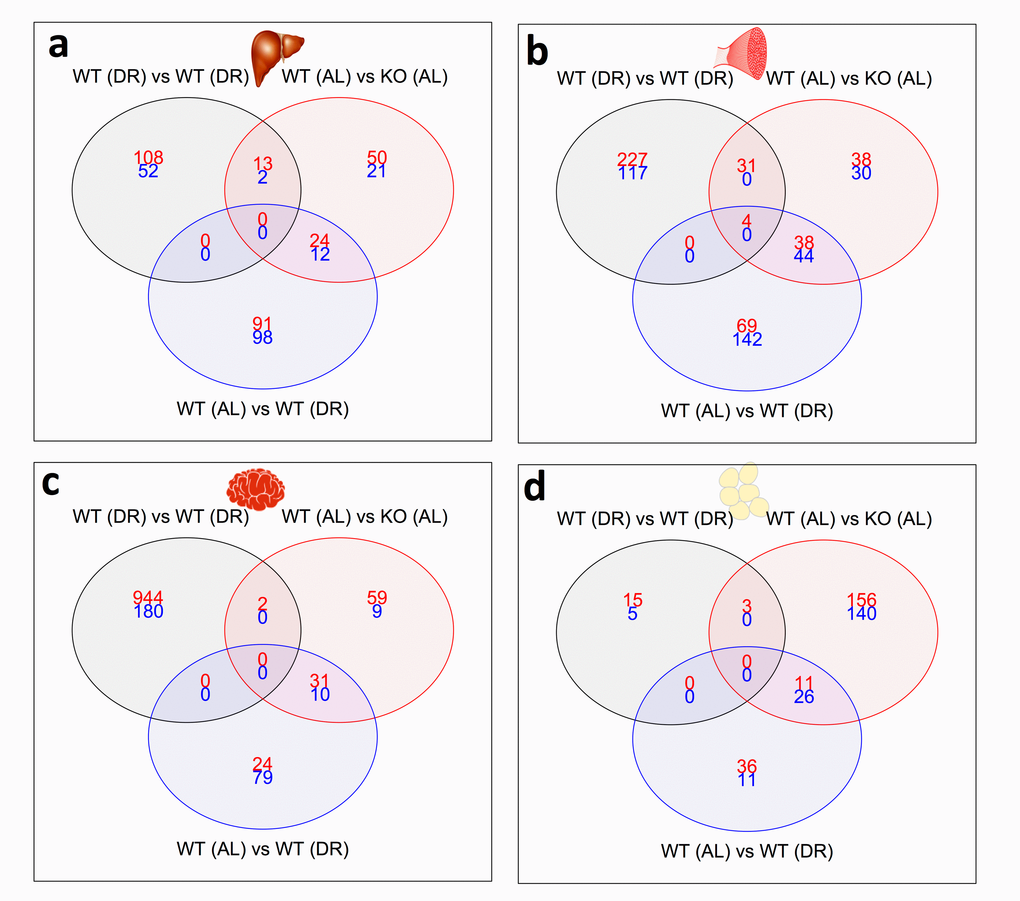
Figure 5. Shared and distinct gene expression profile between KOAL, KODR and WTDR mice. Venn diagram of similar and separate expressed genes across (a) liver, (b) skeletal muscle, (c) WAT and (d) skeletal muscle. Significantly up-regulated genes are shown in red and significantly down-regulated genes are shown in blue. Common genes that are significantly up- or down-regulated are found in overlapping circles. The numbers in the bottom far right denotes the number of genes expressed but not significantly up-regulated (red) or down-regulated (blue).
Transcriptional direction between KOAL and WTDR mice
There was a significant correlation of significantly differentially expressed genes (FDR < 10%) between KOAL (vs WTAL) and WTDR (vs WTAL) mice across all tissues (Fig. S2a-d), with the highest correlation noted in brain (Fig. S2c) and the weakest in liver (Fig. 21). The magnitude of the fold change of significantly (FDR < 10%) differentially expressed genes associated with the loss of IRS1 was typically greater under AL (KOAL) conditions compared to those under DR (KODR) conditions (Fig. 6a), Similarly, signatures associated with DR tended to be greater in WT (WTDR) mice compared to KO (KODR) mice (Fig. 6b). Together, these data suggest that the gene expression changes induced by the loss of IRS1 are repressed under DR conditions in liver, skeletal muscle and WAT, but in brain there appears to be a unique gene expression response in mice that lack IRS1 and challenged with DR (Fig. 6a).
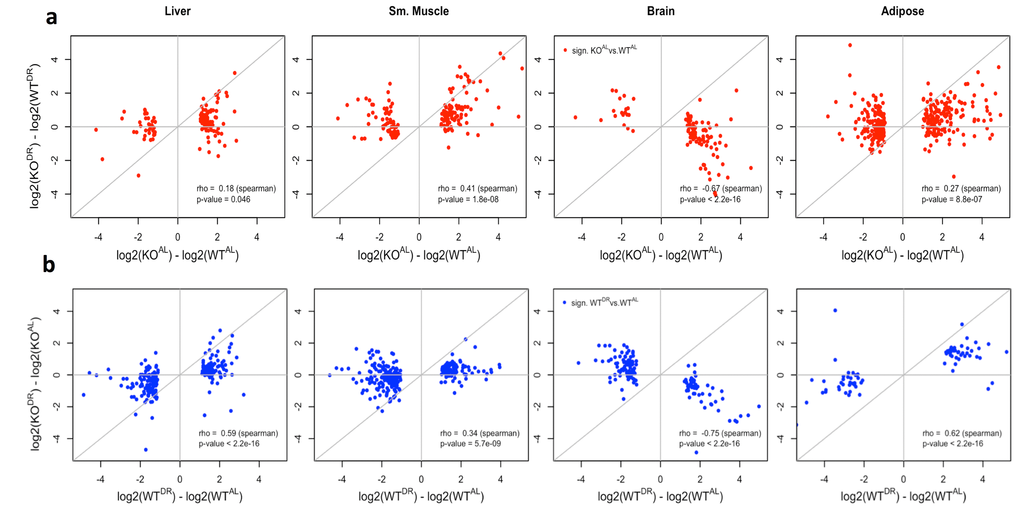
Figure 6. Correlation of WT and KO fed AL or DR diets. (a) The log2 fold change correlation between WT and KO fed AL or DR conditions of genes significantly differentially expressed (q value < 0.10) when comparing WT and KO expression in AL conditions (red). (b) The log2 fold change between AL or DR conditions in WT and KO backgrounds of genes significantly differentially expressed (q value < 0.10) when comparing AL and DR conditions in a WT background (blue).
Additionally, genes in liver, skeletal muscle and WAT that were significantly differentially expressed between WTALand KOAL also tended to be differentially expressed (although not always significantly) when comparing WTAL and WTDR comparison. If the loss of IRS1 and the effects of DR on gene expression were additive, then the expectation would be that the magnitude of gene expression change between the extremes (WTAL and KODR) would be greater than the changes between WTAL and KOAL. Instead, the data suggested a plateau for gene expression changes, except in the brain where changes associated with the loss of IRS1 were clearly suppressed under DR (Fig. S3a, S4). Again similarly, gene expression changes associated with DR conditions appeared to reach a plateau in KO mice. The correlation between genes significantly differentially expressed between WTAL and WTDR compared to the fold change between the two extreme conditions (WTAL and KODR) had a similar fold change magnitude in the liver, skeletal muscle and WAT, whereas changes in brain had a smaller magnitude of change in Irs1-/- mice (Fig. 3b, S4).
KOAL mice phenocopy WTDR mice but DR additively affects body mass and body composition in Irs1 KO mice
When KOAL mice were maintained on a normal chow diet they were significantly lighter, leaner and had significantly reduced plasma leptin levels compared to WTAL mice, despite being hyperphagic (Fig. 7 a-f). Following 12 months of 30% DR, body mass (F=38.38, p<0.0001) was significantly reduced in both (WTDR) and (KODR) mice relative to their appropriate ad libitum controls (Fig. 7a; WTAL and KOAL respectively). However, upon completion of the study the weight loss in WTDR mice was greater (36% loss relative to WTAL) compared to KODR mice (21% loss relative to KOAL) (Fig. 7b; interaction, F=10.97, p=0.002). Fat-free mass (% BM) was higher in DR mice, regardless of genotype, with KO mice having more fat-free mass compared to WT mice (Fig. 7c; genotype F=7.135, p=0.014; treatment F=12.667, p=0.002). In addition, DR further reduced fat mass (% of BM) in the already lean KO mice (Fig. 7d; genotype F=6.467, p=0.0185; treatment F=15.24, p=0.0008). Plasma leptin levels (Fig. 7e) were similarly affected by genotype (F= 18.845, p<0.001) and treatment (F=33.478, p<0.001), although a significant interaction existed between genotype and treatment (F=19.879, p<0.001), with the magnitude of the effect of DR on leptin levels being much greater in the WT mice. Mass-corrected food intake of KOAL mice was significantly higher (F=6.065, p<0.0001) than WTAL mice at 15 months of age (Fig. 7f). Glucose tolerance was significantly enhanced in KO mice relative to WT mice at 15 months of age (F=11.031, p=0.002; Fig. 8a, b), although there was no additional benefit of DR on glucose tolerance in either genotype (F=3.148, p=0.084). Fed blood glucose (Fig. 8c) levels were unaffected by genotype (F=1.075, p=0.306) and treatment (F=3.923, p=0.055), as was the case for fasting insulin levels (Fig. 8d; genotype F=0.867, p=0.358; treatment F=3.106, p=0.086). A significant genotype effect (F=5.023, p=0.031), but no treatment effect (F=1.252, p=0.270), was seen in plasma resistin levels (Fig. 8e).
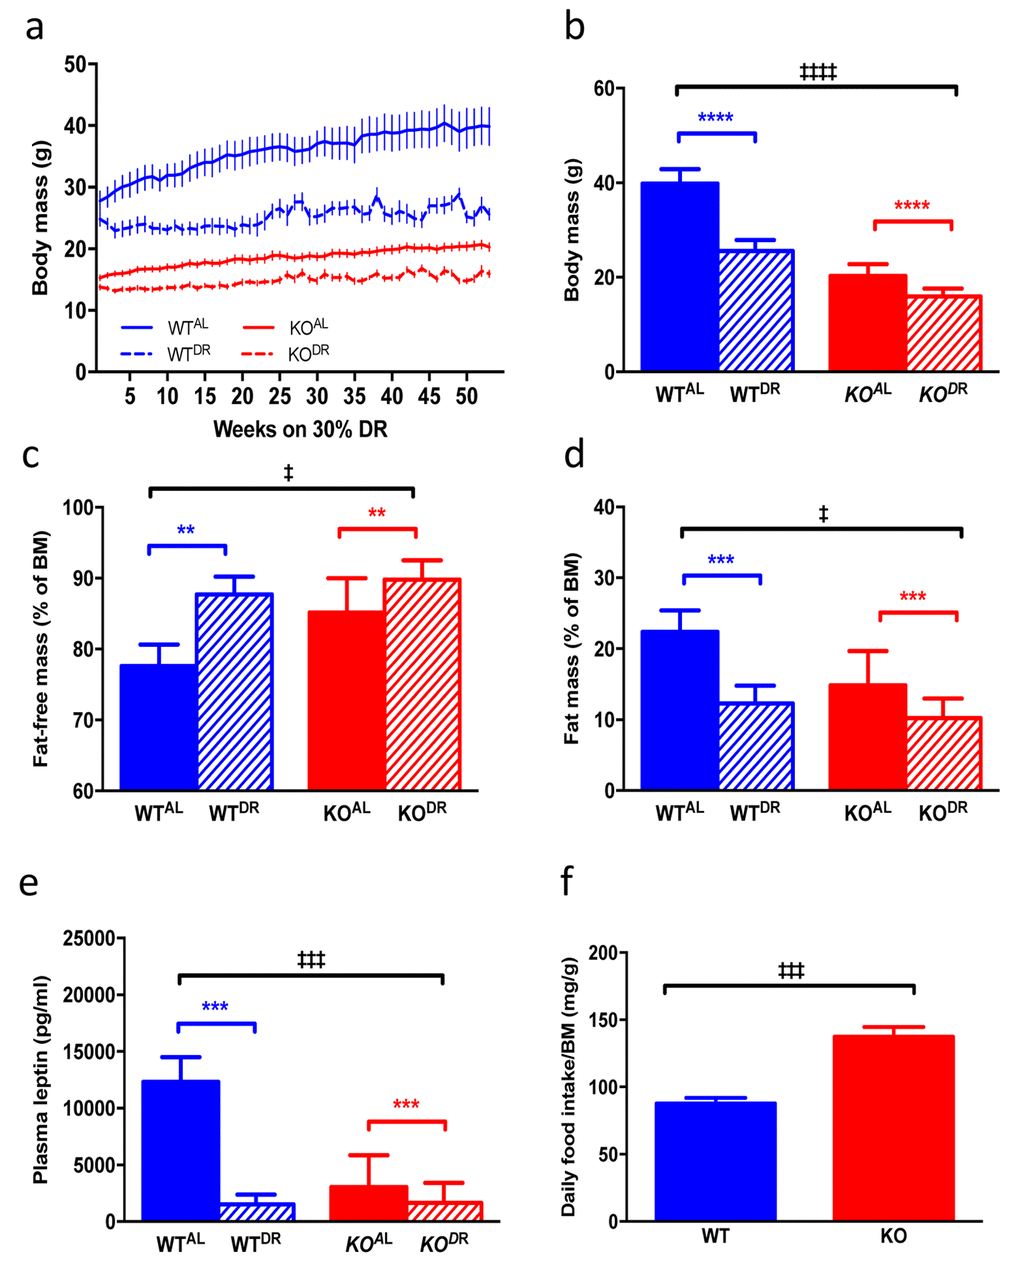
Figure 7. Body mass and adipose physiology of WT and KO mice on AL and DR diets. (a) Raw body mass measurements of WTAL, WTDR, KOAL, KODR for 52 weeks once DR mice reached 30% DR. (b) Body mass of mice at final time point of 52 weeks. (c) Fat-free mass (% of body mass) of mice at 12 months of DR. (d) Fat mass (% of body mass) of mice at 12 months of DR. (e) Plasma leptin levels in mice at 12 months of DR. (f) Daily food intake (corrected for body mass) of mice fed AL diets. WTAL, n = 8; WTDR, n = 6; KOAL, n = 14; KODR, n = 10. Error bars represent mean ± SEM. * represents significant effect of treatment and ‡ represents significant effect of genotype. **/‡‡ p < 0.01, ***/‡‡‡ p < 0.001. For a blue lines represent WT mice and red lines represent KO mice; solid lines represent mice fed an AL diet and dashed lines represent mice fed a DR diet. For b-e blue bars are WT mice and red bars are KO mice, solid bars represent AL diet and hatched bars represent DR diet.
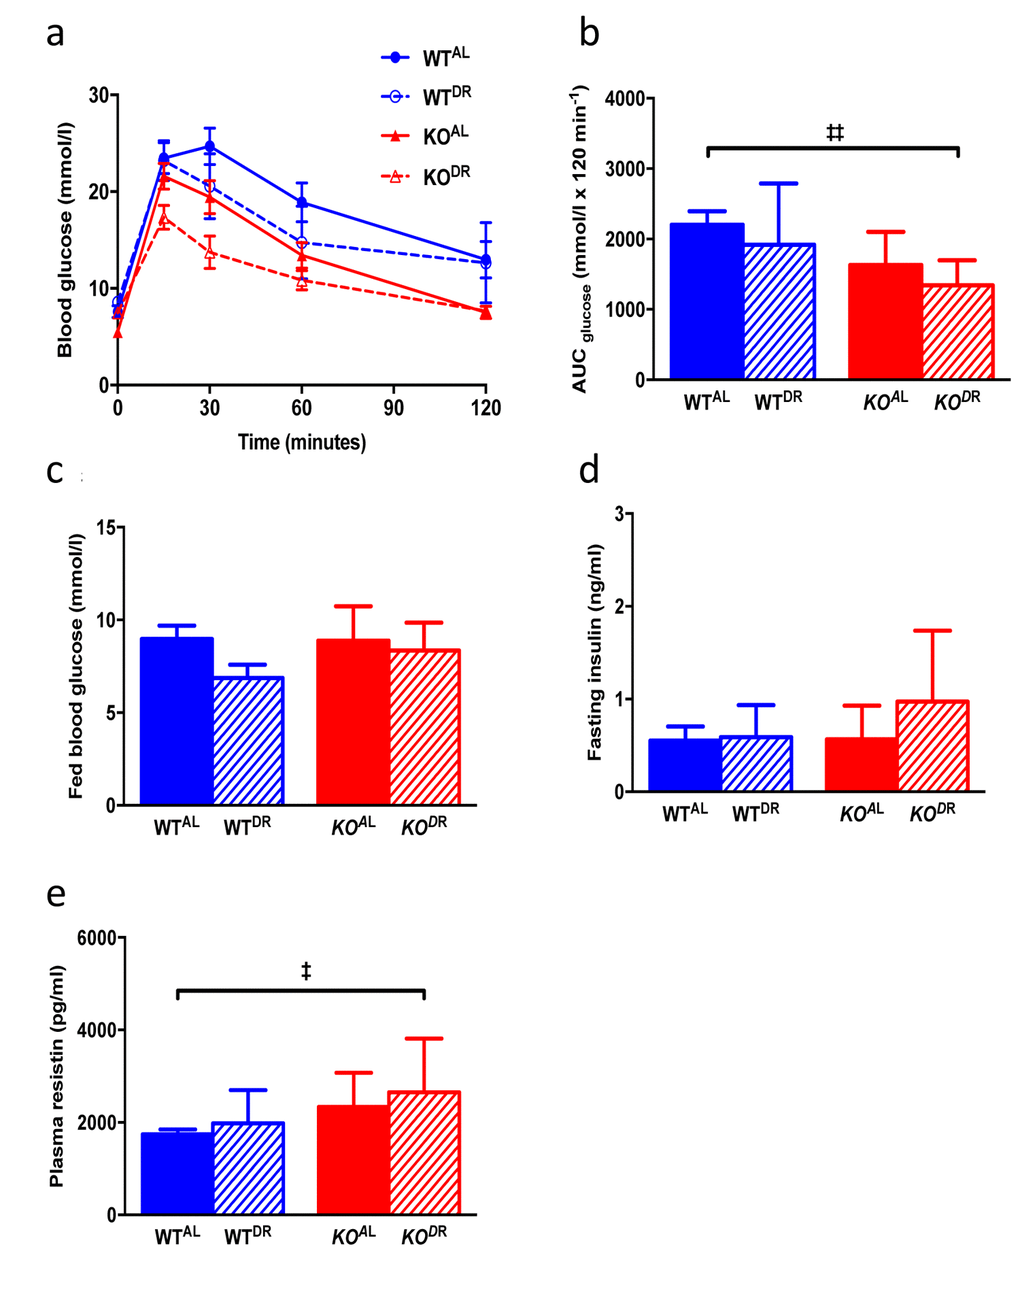
Figure 8. Glucose and insulin metabolism in 15-month-old WT and KO mice. (a) Glucose tolerance curves (b) area under the curve (c) fed blood glucose (d) fasting circulating insulin levels. (e) Plasma resistin levels. WTAL, n = 8; WTDR, n = 6; KOAL, n = 14; KODR, n = 10. Error bars represent mean ± SEM. * represents significant effect of treatment and ‡ represents significant effect of genotype. ‡ p < 0.05; **/‡‡ p < 0.01.
Discussion
In the present study we identified transcriptional signatures within liver, skeletal muscle, brain and inguinal white adipose tissue and measured metabolic parameters in two established mouse models of longevity; genetic global knockout of IRS1 (Irs1-/-, KOAL) and dietary restriction (WTDR) and in Irs1-/- mice subject to 12 months of 30% DR (KODR). We observed very little transcriptional overlap between tissues within either KOAL or WTDR. Such tissue-specific differences within our long-lived models is supported by a recent transcriptomic and proteomic studies in rodents [39,40] and in long-lived IIS mutant flies [41], and indicates that the underlying processes that act overall to modulate longevity and affect healthspan may act independently on specific organs and tissues.
Gene expression of Rpl37a, Rpl31 which both encode components of the 60S ribosomal subunit, and Rps26, which encodes a component of the 40S subunit, were commonly up-regulated across liver, skeletal muscle and brain of KOAL mice. These findings are slightly paradoxical given the reported link between reduced ribosomal biogenesis and longevity in C. elegans [42], and the recent finding that both Irs1-/- and DR mice possess smaller nucleoli in liver, brain and kidney relative to WT controls [43]. However, increased expression of these genes may be evidence of enhanced ribosomal biogenesis/turnover that may reflect a compensatory response to reduce protein synthesis, which has been reported in Irs1-/- mice [44], and/or reflect improved protein quality control in order to maintain optimal ribosomal populations [45]; proteostasis being an established candidate mechanism underlying longevity [46,47]. Of course, it may simply be the case that transcript levels do not reflect protein levels, as previously reported in long-lived Daf-2 mutants [48], and it is also well established that particular ribosomal-associated proteins have additional functions, including DNA repair, apoptosis and tumour suppression, that may have important implications for both lifespan and healthspan [49].
When comparing gene regulation between tissues from WTDR mice, we found only Sfrp5, a Wnt antagonist, to be down-regulated within skeletal muscle, brain, and WAT. This is in line with whole transcriptome analysis of WAT from WT mice following short-term DR [50]. Wnt signalling has been implicated in aging at both the cellular and whole animal level [51,52], and reduced Wnt signalling is implicated in the lifespan extension noted in C. elegans [53] and Klotho transgenic mice [52,54]. GO categories related to ribosomal biogenesis were identified in the up-regulated gene sets of liver and muscle in WTDR mice, with a large number of GO categories linked to lipid metabolic processes over-represented in muscle. Several GO categories linked to cognition and behaviour were identified in the up-regulated gene set of the WTDR mice supporting evidence that lifelong DR increases working memory in mice [55].
The RNA sequencing approach enabled us to identify transcriptional commonality within individual tissues between KOAL and WTDR mice. Of the shared transcriptional regulation within both interventions (KOAL mice and WTDR), an increased number of transcripts were associated with ribosomal biogenesis, particularly in liver, muscle and brain of KOAL mice and liver and muscle of WTDR mice. We have previously shown that the metabolic phenotype (metabotype) of plasma from Irs1-/- mice revealed significantly lower levels of methionine [35]. Methionine restriction, another dietary intervention, which extends lifespan in rodent models [56], induces genes that encode ribosomal proteins [39], leading the authors of the latter study to suggest that their results may be due to methionine restriction causing inefficient translation due to lack of functional, fully aggregated ribosomes [39]. The common transcriptional regulation supports our earlier work in which, using a whole-genome approach, where we compared the hepatic transcriptional profile of long-lived S6K1 KO mice to WTDR mice and to KOAL mice [14]. We also observed that genes associated with skeletal muscle proliferation and differentiation were up-regulated in WAT of KOAL and WTDR mice, this finding may indicate beiging of WAT. Brown adipocytes originate from a precursor shared with skeletal muscle [57] and beiging of inguinal WAT has previously been reported in dietary restricted mice [58]. Despite the common overlap in gene regulation we observed a far greater number of significantly altered genes that were unique to either KOAL or WTDR mice. This finding contrasts to those reported in a comparison between long-lived AC5 KO mice and WT mice challenged with 40% DR, in which gene expression profiles across brain, heart, skeletal muscle and liver showed significant commonality [33].
We also noted up-regulated genes involved in fatty acid metabolism within tissues of KOAL mice and several shared between KOAL and WTDR in skeletal muscle and WAT, suggesting that enhanced fatty acid metabolism is a common mechanism shared between IIS and DR. Overexpression of fatty-acid-β-oxidation related genes has been reported to extend lifespan in Drosophila [59], with increased fatty acid metabolism linked to enhanced autophagy which correlates with longevity and confers protection against metabolic syndrome during aging [60]. In contrast, genes involved in inflammation were commonly down-regulated in tissues isolated from KOAL mice. Levels of inflammation have been linked to health and longevity [61,62] and an enhanced immune response has previously been reported in Irs1-/- mice [13], and in other long-lived mice [13,63,64]. Furthermore, reduced inflammation in long-lived KOAL mice may reflect a more efficient removal of senescent cells which again is correlated with longevity in mice [65,66], although this needs to be verified in the Irs1-/- mice.
The gene regulation profile was strikingly different in KODR compared to either KOAL or WTDR mice, for example more than 1000 genes were uniquely and significantly differentially regulated in brain of KODR mice. Although we did not see any apparent behavioural differences between our mice at the termination of the study, it would be interesting to formally test cognitive function and neural architecture in Irs1-/- mice on DR. We are aware that Irs1-/- mice are already protected against some aspects of cognitive decline during aging [13] in addition to having an increased brain to body ratio compared to WT mice [67]. In comparison to the largely unique gene profile in the brain of KODR mice, we found only 20 genes that were differentially regulated in the WAT of KODR mice. This suggests that WAT is more refractory to the effects of DR in this IIS mutant relative to the other tissues. It is unclear whether this is due to a protective measure against extreme weight loss, which is linked to mortality in AC5 KO mice exposed to DR [33].
Gene profiles that did overlap across KODR, KOAL and WTDR mice, were found only in skeletal muscle, and were once again associated with ribosomal genes; Rpl17, Rpl31 and Rps26. Rpl17 expression positively correlates with ribosome diversity within cells [68] and Rps26 has a potential role in the DNA damage response through transcriptional regulation of p53 activity [69]. Up-regulation of ribosomal genes in skeletal muscle may act as protection against age-related sarcopenia [70].
The findings of our gene profiling indicate clear tissue-specificity in the transcriptional responses observed in both long-lived DR mice and long-lived Irs1-/- mice, suggesting that potential mechanisms acting to slow aging may differ on the level of the tissue/organ, with very few individual genes shared across different tissues within either long-lived model. However, we also show that overlap does exist within the same tissue across these two mouse models, this was also seen in several metabolic parameters, suggesting some commonality exists, although more genes were unique to each model than actually overlapped between the mouse models. Hepatic gene expression profiles revealed that insulin/IGF-1 related genes among others were differentially expressed between Ames dwarfism and dietary restriction [34,74]. Hepatic gene expression was also reported to differ between GHRKO mice and DR [75], however lifespan extension was not as robust in GHRKO mice placed on a 30% DR diet [31].
It has been shown that DR confers an additional increase in lifespan in long-lived Ames dwarf [28] and GHRH knockout mice [29], suggesting that both interventions (genetic mutant v DR) do not act through identical pathways. However, this increase in Ames lifespan under DR was not observed when these mice were maintained on a C57BL/6 background [30], or GHRKO mice under DR [31] or every-other-day feeding [32]. In terms of body mass, body composition and plasma leptin levels Irs1-/- mice somewhat phenocopied WTDR mice, and DR further affected these parameters in KOAL mice suggesting that both DR and reduced IIS act independently on these parameters. Perhaps surprisingly while some glucose homeostasis parameters differed between genotypes, we observed no DR effect on glucose tolerance, fed blood glucose or fasting insulin levels; enhanced glucose tolerance may not be an underlying mechanism in lifespan [71,72]. In Ames dwarf mice, DR led to increased levels of blood glucose whereas insulin measurements were inconclusive as they were undetectable in DR dwarfs [73]. Of course, the definitive experiment will be to expose Irs1-/- mice to life-long DR and assay lifespan to test unequivocally whether these interventions act through similar pathways or not, although this may not be straightforward given that the level of DR required to maximise lifespan in the Drosophila IRS1 homolog Chico is not the same as that required to maximise lifespan in WT flies [21].Thus while some commonality exists transcriptionally and phenotypically between WTDR and KOAL mice, distinct differences existed particularly at the level of transcription that was further magnified by exposing Irs1-/- mice to DR, strongly suggesting that longevity in these mutants is not simply through being a DR mimetic.
Methods
Animals
Genotyping of insulin receptor substrate 1 (IRS1) global knockout (KO) mice followed previously described protocols [76]. Mice were housed in single-sex groups from weaning as previously described [13,36]. Initially mice had ad libitum (AL) access to water and standard chow (D12450B, Research Diets Inc., New Brunswick, NJ, USA; protein 20 kcal%, carbohydrate 70 kcal%, fat 10 kcal%) and kept on a 12L/12D cycle (lights on 0700–1900 h) at a housing temperature of 22 ± 2°C. At 10 weeks of age, groups of male and female wildtype (WT; Irs1+/+) and KO (Irs1-/-) mice were either kept on the AL diet or placed on a dietary restricted (DR) diet to generate 4 experimental groups- WTAL, WTDR, KOAL and KODR. DR mice underwent a step-down protocol as previously described [77–80], with 10% introduced at 10 weeks of age, 20% the following week and maintained at 30% of the food intake of appropriate AL controls until the completion of the study. Food intake of AL mice was determined weekly and 30% DR was calculated from the average AL mice intake over the preceding week [77–80]. DR mice were fed daily between 1630 and 1730hrs, and all mice were weighed weekly. As previously reported [77–79], in our DR groups there was no evidence of one single individual dominating the food source within a cage. Following 12 months of 30% DR (15 months of age) mice were culled by cervical dislocation. Six mice were found dead prior to the final time point of 15 months of age; 2 WTAL males, 2 KOAL males, 1 WTAL female, 1 KODR female. All experiments were undertaken following local ethical review (University of Aberdeen, UK), under licence from the UK Home Office and followed the “principles of laboratory animal care” (NIH Publication No. 86-23, revised 1985).
Dual-energy X-ray absorptiometry (DXA)
Body composition was determined in male and female mice at 15 months of age using dual-energy X-ray absorptiometry (DXA, Lunar PIXImus mouse densitometer, GE Medical Systems, UK). Mice were weighed and anaesthetised with 3% isoflurane (Abbott Laboratories, Berkshire, UK) inhalation for the duration of the scan (~ 4 min-1). Lunar PIXImus 2.10 software was used to calculate total fat mass and total fat-free mass (lean mass). Calculations were made following correction of area of interest (sub-cranial body as recommended by the manufacturer) as previously described [79,81].
Glucose homeostasis and fasting hormone levels
Glucose tolerance was determined in male and female mice following an overnight fast (~15 h-1) with DR mice fed at 1500 hrs on the day immediately prior to the test, as previously described1. In brief, mice were weighed and a fasted blood glucose measurement was collected from a tail vein sample using a glucometer (OneTouch Ultra, Lifescan, UK). Mice were then injected intraperitoneally with a 20% glucose solution (2g/kg) and blood glucose levels were determined at 15, 30, 60 and 120 min-1 post-injection. Glucose tolerance is expressed as area under the curve. Fed blood glucose was determined in AL mice at 1100hrs and in DR mice at 1800hrs1 Fasting plasma insulin, leptin and resistin levels were determined using a mouse serum adipokine kit (# MADPK-71K, Millipore Corp., Missouri, U.S.A).
RNA extraction
mRNA was isolated from brain, skeletal muscle, liver and inguinal white adipose tissue from WTAL (n=2), WTDR (n=3), KOAL (n=3) and KODR (n=3) female mice at 15 months of age (12 months of 30% DR) using Tri-Reagent (Life Technologies, Paisley, UK) and Qiagen RNeasy Mini Kit (Sussex, UK), following manufacturer’s protocols. RNA was re-suspended in ultra-pure water, RNA concentration and purity was determined by spectrophotometry (NanoDrop, Fisher Scientific).
RNA-sequencing using Ion Proton™ System
Gene expression analysis was performed by sequencing the extracted RNAs having 3' poly-A tail and quantifying the expression levels of all sequenced genes. The extracted RNAs were prepared using a Dynabeads® mRNA DIRECT™ Micro Purification Kit (Thermo Fisher Scientific Inc.) to perform the poly A selection followed by an Ion Total RNA-Seq Kit v2 to prepare the library from the poly A selected RNAs. The constructed libraries were sequenced on an Ion Proton™ System (Thermo Fisher Scientific Inc.) using P1 chip (version P1.1.17) according to the manufacturer’s protocol.
Quality of the raw sequence data was analysed using Torrent Suite (version 4.0.2) and FastQC (version 0.10.1) (http://www.bioinformatics.babraham.ac.uk/projects/fastqc/) tools. The single end reads generated with Ion Proton sequencer were pre-processed with cutadapt (version 1.5) [82] tool to remove 3’ end adapters and sickle (version 0.940) [83] to remove 3’ end sequence stretches with quality value lower than 10 and to filter out reads shorter than 54 bp (flags “–q 10 –l 54”). The remaining reads were then mapped to the Ensembl mouse genome version GRCm38 using BBmap software (version 34.90) (https://sourceforge.net/projects/bbmap/). In order to maximize the number of unique alignments the initial alignment was followed by ten additional alignment iterations. At each iteration the unmapped reads were subjected to the process where base pairs were excised from the original full length reads at positions i-1*18+1 (where i is the iteration number) and subjected to alignment using the BBmap aligner. Thus the 75 bp aligned sequence stretches were excised at position 1, 19, 37, 55, 73, 92, 109, 127, 145 and 163 for each of the ten iterations, respectively, from the original full-length reads. The iterative alignment strategy applied here increased the percentage of aligned reads from 77.1% to 97.1% and percentage of uniquely aligned reads from 68.1% to 84.2% on average over 43 samples.
Differential expression analysis
Differential expression analysis was performed using cuffdiff (version 2.2.1) [38] applying --multi-read-correct and --compatible-hits-norm options. A false discovery rate of 10% was allowed and the minimum number of aligned reads in a locus needed to conduct significance testing was kept at 8. The libraries prepared from each sample were normalised using the geometric mean across the samples [84] and the dispersion between the replicates were estimated for each condition. Using R (version 3.1.1) and cummeRbund (version 2.8.2) exploratory data analysis was performed [85]. The RNA-seq data is available in GEO (GSE106903).
Enrichment analysis and clustering
Gene Ontology term analysis performed with hypergeometric tests using GOstats [86] in R/Bioconductor (version 3.2.3) and annotation from package org.mm.eg.db. Plots, heatmaps and venn diagrams associated with gene expression data created with R/Bioconductor, and heatmaps generated from hierarchical cluster analysis using distance matrices generated from spearman (genes) or pearson (conditions) correlations. Fisher’s exact test was used to assess enrichment of annotation (e.g. genes up regulated genes by DR in the liver) in a set of genes (e.g. genes up-regulated by IRS1 mutation) and is the most commonly used tool for a gene list enrichment analysis [87].
Analysis of treatment and genotype
Additional statistical analyses were performed with SPSS 23.0, using a critical value α-level of p ≤ 0.05. For most analyses we used two-way analysis of variance (ANOVA) to assess factors of treatment and genoype, using Bonferroni post hoc corrections. For treatment effects, * represents p<0.05, ** represents p<0.01, and *** represents p<0.001; for genotype effects, ‡ represents p<0.05, ‡‡ represents p<0.01, and ‡‡‡ represents p<0.001.
Supplementary Materials
Author Contributions
MMP performed all experiments, analyzed data and co-wrote the manuscript. EFS analyzed data and co-wrote the manuscript. MM and PH performed the RNA-sequencing experiment and edited the manuscript. DJW provided critical reagents and edited the manuscript. CS conceptualized and designed studies, analysed data and co-wrote the manuscript.
Acknowledgements
We thank Biological Services Unit staff (University of Aberdeen) for animal care, Prof. John Speakman and Dr Sharon Mitchell (University of Aberdeen) for access to the Lunar PIXImus mouse densitometer and technical support, Julie Galbraith, Jing Wang and Dr Amy Sinclair (University of Glasgow). The next generation sequencing was performed by Glasgow Polyomics facility at the University of Glasgow.
Conflicts of Interest
The authors declare that they have no conflicts of interests.
Funding
This work was supported through a BBSRC New Investigator Grant (reference BB/H012850/2) and start-up funds from University of Glasgow (College of Medicine, Veterinary and Life Sciences) to CS and a Wellcome Trust Strategic Award (reference 098565/Z/12/Z) to DJW.
References
- 1. Selman C. Dietary restriction and the pursuit of effective mimetics. Proc Nutr Soc. 2014; 73:260–70. https://doi.org/10.1017/S0029665113003832 [PubMed]
- 2. Gems D, Partridge L. Genetics of longevity in model organisms: debates and paradigm shifts. Annu Rev Physiol. 2013; 75:621–44. https://doi.org/10.1146/annurev-physiol-030212-183712 [PubMed]
- 3. Piper MD, Selman C, McElwee JJ, Partridge L. Separating cause from effect: how does insulin/IGF signalling control lifespan in worms, flies and mice? J Intern Med. 2008; 263:179–91. https://doi.org/10.1111/j.1365-2796.2007.01906.x [PubMed]
- 4. Osborne TB, Mendel LB, Ferry EL. The effect of retardation of growth upon the breeding period and duration of life of rats. Science. 1917; 45:294–95. https://doi.org/10.1126/science.45.1160.294 [PubMed]
- 5. Fontana L, Partridge L. Promoting health and longevity through diet: from model organisms to humans. Cell. 2015; 161:106–18. https://doi.org/10.1016/j.cell.2015.02.020 [PubMed]
- 6. Grandison RC, Piper MD, Partridge L. Amino-acid imbalance explains extension of lifespan by dietary restriction in Drosophila. Nature. 2009; 462:1061–64. https://doi.org/10.1038/nature08619 [PubMed]
- 7. Miller RA, Buehner G, Chang Y, Harper JM, Sigler R, Smith-Wheelock M. Methionine-deficient diet extends mouse lifespan, slows immune and lens aging, alters glucose, T4, IGF-I and insulin levels, and increases hepatocyte MIF levels and stress resistance. Aging Cell. 2005; 4:119–25. https://doi.org/10.1111/j.1474-9726.2005.00152.x [PubMed]
- 8. Mair W, Dillin A. Aging and survival: the genetics of life span extension by dietary restriction. Annu Rev Biochem. 2008; 77:727–54. https://doi.org/10.1146/annurev.biochem.77.061206.171059 [PubMed]
- 9. Fontana L, Meyer TE, Klein S, Holloszy JO. Long-term calorie restriction is highly effective in reducing the risk for atherosclerosis in humans. Proc Natl Acad Sci USA. 2004; 101:6659–63. https://doi.org/10.1073/pnas.0308291101 [PubMed]
- 10. Speakman JR, Mitchell SE. Caloric restriction. Mol Aspects Med. 2011; 32:159–221. https://doi.org/10.1016/j.mam.2011.07.001 [PubMed]
- 11. Kenyon C. The first long-lived mutants: discovery of the insulin/IGF-1 pathway for ageing. Philos Trans R Soc Lond B Biol Sci. 2011; 366:9–16. https://doi.org/10.1098/rstb.2010.0276 [PubMed]
- 12. Clancy DJ, Gems D, Harshman LG, Oldham S, Stocker H, Hafen E, Leevers SJ, Partridge L. Extension of life-span by loss of CHICO, a Drosophila insulin receptor substrate protein. Science. 2001; 292:104–06. https://doi.org/10.1126/science.1057991 [PubMed]
- 13. Selman C, Lingard S, Choudhury AI, Batterham RL, Claret M, Clements M, Ramadani F, Okkenhaug K, Schuster E, Blanc E, Piper MD, Al-Qassab H, Speakman JR, et al. Evidence for lifespan extension and delayed age-related biomarkers in insulin receptor substrate 1 null mice. FASEB J. 2008; 22:807–18. https://doi.org/10.1096/fj.07-9261com [PubMed]
- 14. Selman C, Tullet JM, Wieser D, Irvine E, Lingard SJ, Choudhury AI, Claret M, Al-Qassab H, Carmignac D, Ramadani F, Woods A, Robinson IC, Schuster E, et al. Ribosomal protein S6 kinase 1 signaling regulates mammalian life span. Science. 2009; 326:140–44. https://doi.org/10.1126/science.1177221 [PubMed]
- 15. Hofmann JW, Zhao X, De Cecco M, Peterson AL, Pagliaroli L, Manivannan J, Hubbard GB, Ikeno Y, Zhang Y, Feng B, Li X, Serre T, Qi W, et al. Reduced expression of MYC increases longevity and enhances healthspan. Cell. 2015; 160:477–88. https://doi.org/10.1016/j.cell.2014.12.016 [PubMed]
- 16. Lamming DW, Ye L, Katajisto P, Goncalves MD, Saitoh M, Stevens DM, Davis JG, Salmon AB, Richardson A, Ahima RS, Guertin DA, Sabatini DM, Baur JA. Rapamycin-induced insulin resistance is mediated by mTORC2 loss and uncoupled from longevity. Science. 2012; 335:1638–43. https://doi.org/10.1126/science.1215135 [PubMed]
- 17. Selman C, Withers DJ. Mammalian models of extended healthy lifespan. Philos Trans R Soc Lond B Biol Sci. 2011; 366:99–107. https://doi.org/10.1098/rstb.2010.0243 [PubMed]
- 18. van Heemst D, Beekman M, Mooijaart SP, Heijmans BT, Brandt BW, Zwaan BJ, Slagboom PE, Westendorp RG. Reduced insulin/IGF-1 signalling and human longevity. Aging Cell. 2005; 4:79–85. https://doi.org/10.1111/j.1474-9728.2005.00148.x [PubMed]
- 19. Passtoors WM, Beekman M, Deelen J, van der Breggen R, Maier AB, Guigas B, Derhovanessian E, van Heemst D, de Craen AJ, Gunn DA, Pawelec G, Slagboom PE. Gene expression analysis of mTOR pathway: association with human longevity. Aging Cell. 2013; 12:24–31. https://doi.org/10.1111/acel.12015 [PubMed]
- 20. López-Otín C, Blasco MA, Partridge L, Serrano M, Kroemer G. The hallmarks of aging. Cell. 2013; 153:1194–217. https://doi.org/10.1016/j.cell.2013.05.039 [PubMed]
- 21. Clancy DJ, Gems D, Hafen E, Leevers SJ, Partridge L. Dietary restriction in long-lived dwarf flies. Science. 2002; 296:319. https://doi.org/10.1126/science.1069366 [PubMed]
- 22. Ogg S, Paradis S, Gottlieb S, Patterson GI, Lee L, Tissenbaum HA, Ruvkun G. The Fork head transcription factor DAF-16 transduces insulin-like metabolic and longevity signals in C. elegans. Nature. 1997; 389:994–99. https://doi.org/10.1038/40194 [PubMed]
- 23. Lakowski B, Hekimi S. The genetics of caloric restriction in Caenorhabditis elegans. Proc Natl Acad Sci USA. 1998; 95:13091–96. https://doi.org/10.1073/pnas.95.22.13091 [PubMed]
- 24. Houthoofd K, Braeckman BP, Johnson TE, Vanfleteren JR. Life extension via dietary restriction is independent of the Ins/IGF-1 signalling pathway in Caenorhabditis elegans. Exp Gerontol. 2003; 38:947–54. https://doi.org/10.1016/S0531-5565(03)00161-X [PubMed]
- 25. Giannakou ME, Goss M, Partridge L. Role of dFOXO in lifespan extension by dietary restriction in Drosophila melanogaster: not required, but its activity modulates the response. Aging Cell. 2008; 7:187–98. https://doi.org/10.1111/j.1474-9726.2007.00362.x [PubMed]
- 26. Greer EL, Brunet A. Different dietary restriction regimens extend lifespan by both independent and overlapping genetic pathways in C. elegans. Aging Cell. 2009; 8:113–27. https://doi.org/10.1111/j.1474-9726.2009.00459.x [PubMed]
- 27. Argentino DP, Dominici FP, Muñoz MC, Al-Regaiey K, Bartke A, Turyn D. Effects of long-term caloric restriction on glucose homeostasis and on the first steps of the insulin signaling system in skeletal muscle of normal and Ames dwarf (Prop1df/Prop1df) mice. Exp Gerontol. 2005; 40:27–35. https://doi.org/10.1016/j.exger.2004.09.005 [PubMed]
- 28. Bartke A, Wright JC, Mattison JA, Ingram DK, Miller RA, Roth GS. Extending the lifespan of long-lived mice. Nature. 2001; 414:412–412. https://doi.org/10.1038/35106646 [PubMed]
- 29. Sun LY, Spong A, Swindell WR, Fang Y, Hill C, Huber JA, Boehm JD, Westbrook R, Salvatori R, Bartke A. Growth hormone-releasing hormone disruption extends lifespan and regulates response to caloric restriction in mice. eLife. 2013; 2:e01098. https://doi.org/10.7554/eLife.01098 [PubMed]
- 30. Garcia AM, Busuttil RA, Calder RB, Dollé ME, Diaz V, McMahan CA, Bartke A, Nelson J, Reddick R, Vijg J. Effect of Ames dwarfism and caloric restriction on spontaneous DNA mutation frequency in different mouse tissues. Mech Ageing Dev. 2008; 129:528–33. https://doi.org/10.1016/j.mad.2008.04.013 [PubMed]
- 31. Bonkowski MS, Rocha JS, Masternak MM, Al Regaiey KA, Bartke A. Targeted disruption of growth hormone receptor interferes with the beneficial actions of calorie restriction. Proc Natl Acad Sci USA. 2006; 103:7901–05. https://doi.org/10.1073/pnas.0600161103 [PubMed]
- 32. Bonkowski MS, Dominici FP, Arum O, Rocha JS, Al Regaiey KA, Westbrook R, Spong A, Panici J, Masternak MM, Kopchick JJ, Bartke A. Disruption of growth hormone receptor prevents calorie restriction from improving insulin action and longevity. PLoS One. 2009; 4:e4567. https://doi.org/10.1371/journal.pone.0004567 [PubMed]
- 33. Yan L, Park JY, Dillinger JG, De Lorenzo MS, Yuan C, Lai L, Wang C, Ho D, Tian B, Stanley WC, Auwerx J, Vatner DE, Vatner SF. Common mechanisms for calorie restriction and adenylyl cyclase type 5 knockout models of longevity. Aging Cell. 2012; 11:1110–20. https://doi.org/10.1111/acel.12013 [PubMed]
- 34. Tsuchiya T, Dhahbi JM, Cui X, Mote PL, Bartke A, Spindler SR. Additive regulation of hepatic gene expression by dwarfism and caloric restriction. Physiol Genomics. 2004; 17:307–15. https://doi.org/10.1152/physiolgenomics.00039.2004 [PubMed]
- 35. Wijeyesekera A, Selman C, Barton RH, Holmes E, Nicholson JK, Withers DJ. Metabotyping of long-lived mice using 1H NMR spectroscopy. J Proteome Res. 2012; 11:2224–35. https://doi.org/10.1021/pr2010154 [PubMed]
- 36. Selman C, Partridge L, Withers DJ. Replication of extended lifespan phenotype in mice with deletion of insulin receptor substrate 1. PLoS One. 2011; 6:e16144. https://doi.org/10.1371/journal.pone.0016144 [PubMed]
- 37. Page MM, Sinclair A, Robb EL, Stuart JA, Withers DJ, Selman C. Fibroblasts derived from long-lived insulin receptor substrate 1 null mice are not resistant to multiple forms of stress. Aging Cell. 2014; 13:962–64. https://doi.org/10.1111/acel.12255 [PubMed]
- 38. Trapnell C, Hendrickson DG, Sauvageau M, Goff L, Rinn JL, Pachter L. Differential analysis of gene regulation at transcript resolution with RNA-seq. Nat Biotechnol. 2013; 31:46–53. https://doi.org/10.1038/nbt.2450 [PubMed]
- 39. Ghosh S, Wanders D, Stone KP, Van NT, Cortez CC, Gettys TW. A systems biology analysis of the unique and overlapping transcriptional responses to caloric restriction and dietary methionine restriction in rats. FASEB J. 2014; 28:2577–90. https://doi.org/10.1096/fj.14-249458 [PubMed]
- 40. Ghosh S, Forney LA, Wanders D, Stone KP, Gettys TW. An integrative analysis of tissue-specific transcriptomic and metabolomic responses to short-term dietary methionine restriction in mice. PLoS One. 2017; 12:e0177513. https://doi.org/10.1371/journal.pone.0177513 [PubMed]
- 41. Tain LS, Sehlke R, Jain C, Chokkalingam M, Nagaraj N, Essers P, Rassner M, Grönke S, Froelich J, Dieterich C, Mann M, Alic N, Beyer A, Partridge L. A proteomic atlas of insulin signalling reveals tissue-specific mechanisms of longevity assurance. Mol Syst Biol. 2017; 13:939. https://doi.org/10.15252/msb.20177663 [PubMed]
- 42. Hansen M, Taubert S, Crawford D, Libina N, Lee SJ, Kenyon C. Lifespan extension by conditions that inhibit translation in Caenorhabditis elegans. Aging Cell. 2007; 6:95–110. https://doi.org/10.1111/j.1474-9726.2006.00267.x [PubMed]
- 43. Tiku V, Jain C, Raz Y, Nakamura S, Heestand B, Liu W, Späth M, Suchiman HE, Müller RU, Slagboom PE, Partridge L, Antebi A. Small nucleoli are a cellular hallmark of longevity. Nat Commun. 2016; 8:16083. https://doi.org/10.1038/ncomms16083 [PubMed]
- 44. Essers P, Tain LS, Nespital T, Goncalves J, Froehlich J, Partridge L. Reduced insulin/insulin-like growth factor signaling decreases translation in Drosophila and mice. Sci Rep. 2016; 6:30290. https://doi.org/10.1038/srep30290 [PubMed]
- 45. Mathis AD, Naylor BC, Carson RH, Evans E, Harwell J, Knecht J, Hexem E, Peelor FF
3rd , Miller BF, Hamilton KL, Transtrum MK, Bikman BT, Price JC. Mechanisms of in vivo ribosome maintenance change in response to nutrient signals. Mol Cell Proteomics. 2017; 16:243–54. https://doi.org/10.1074/mcp.M116.063255 [PubMed] - 46. Pechmann S, Willmund F, Frydman J. The ribosome as a hub for protein quality control. Mol Cell. 2013; 49:411–21. https://doi.org/10.1016/j.molcel.2013.01.020 [PubMed]
- 47. Sands WA, Page MM, Selman C. Proteostasis and ageing: insights from long-lived mutant mice. J Physiol. 2017; 595:6383–90. https://doi.org/10.1113/JP274334 [PubMed]
- 48. Depuydt G, Xie F, Petyuk VA, Shanmugam N, Smolders A, Dhondt I, Brewer HM, Camp DG
2nd , Smith RD, Braeckman BP. Reduced insulin/insulin-like growth factor-1 signaling and dietary restriction inhibit translation but preserve muscle mass in Caenorhabditis elegans. Mol Cell Proteomics. 2013; 12:3624–39. https://doi.org/10.1074/mcp.M113.027383 [PubMed] - 49. Takafuji T, Kayama K, Sugimoto N, Fujita M. GRWD1, a new player among oncogenesis-related ribosomal/nucleolar proteins. Cell Cycle. 2017; 16:1397–403. https://doi.org/10.1080/15384101.2017.1338987 [PubMed]
- 50. Kim SS, Choi KM, Kim S, Park T, Cho IC, Lee JW, Lee CK. Whole-transcriptome analysis of mouse adipose tissue in response to short-term caloric restriction. Mol Genet Genomics. 2016; 291:831–47. https://doi.org/10.1007/s00438-015-1150-3 [PubMed]
- 51. Castilho RM, Squarize CH, Chodosh LA, Williams BO, Gutkind JS. mTOR mediates Wnt-induced epidermal stem cell exhaustion and aging. Cell Stem Cell. 2009; 5:279–89. https://doi.org/10.1016/j.stem.2009.06.017 [PubMed]
- 52. Liu H, Fergusson MM, Castilho RM, Liu J, Cao L, Chen J, Malide D, Rovira II, Schimel D, Kuo CJ, Gutkind JS, Hwang PM, Finkel T. Augmented Wnt signaling in a mammalian model of accelerated aging. Science. 2007; 317:803–06. https://doi.org/10.1126/science.1143578 [PubMed]
- 53. Lezzerini M, Budovskaya Y. A dual role of the Wnt signaling pathway during aging in Caenorhabditis elegans. Aging Cell. 2014; 13:8–18. https://doi.org/10.1111/acel.12141 [PubMed]
- 54. Mirza SB, Ekhteiari Salmas R, Fatmi MQ, Durdagi S. Discovery of Klotho peptide antagonists against Wnt3 and Wnt3a target proteins using combination of protein engineering, protein-protein docking, peptide docking and molecular dynamics simulations. J Enzyme Inhib Med Chem. 2017; 32:84–98. https://doi.org/10.1080/14756366.2016.1235569 [PubMed]
- 55. Kuhla A, Lange S, Holzmann C, Maass F, Petersen J, Vollmar B, Wree A. Lifelong caloric restriction increases working memory in mice. PLoS One. 2013; 8:e68778. https://doi.org/10.1371/journal.pone.0068778 [PubMed]
- 56. Sun L, Sadighi Akha AA, Miller RA, Harper JM. Life-span extension in mice by preweaning food restriction and by methionine restriction in middle age. J Gerontol A Biol Sci Med Sci. 2009; 64:711–22. https://doi.org/10.1093/gerona/glp051 [PubMed]
- 57. Sanchez-Gurmaches J, Guertin DA. Adipocyte lineages: tracing back the origins of fat. Biochim Biophys Acta. 2014; 1842:340–51. https://doi.org/10.1016/j.bbadis.2013.05.027 [PubMed]
- 58. Fabbiano S, Suárez-Zamorano N, Rigo D, Veyrat-Durebex C, Stevanovic Dokic A, Colin DJ, Trajkovski M. Caloric restriction leads to browning of white adipose tissue through type 2 immune signaling. Cell Metab. 2016; 24:434–46. https://doi.org/10.1016/j.cmet.2016.07.023 [PubMed]
- 59. Lee SH, Lee SK, Paik D, Min KJ. Overexpression of fatty-acid-β-oxidation-related genes extends the lifespan of Drosophila melanogaster. Oxid Med Cell Longev. 2012; 2012:854502. https://doi.org/10.1155/2012/854502 [PubMed]
- 60. Singh R. Autophagy and regulation of lipid metabolism. Results Probl Cell Differ. 2010; 52:35–46. https://doi.org/10.1007/978-3-642-14426-4_4 [PubMed]
- 61. Tang Y, Purkayastha S, Cai D. Hypothalamic microinflammation: a common basis of metabolic syndrome and aging. Trends Neurosci. 2015; 38:36–44. https://doi.org/10.1016/j.tins.2014.10.002 [PubMed]
- 62. Bernal GM, Wahlstrom JS, Crawley CD, Cahill KE, Pytel P, Liang H, Kang S, Weichselbaum RR, Yamini B. Loss of Nfkb1 leads to early onset aging. Aging (Albany NY). 2014; 6:931–43. https://doi.org/10.18632/aging.100702 [PubMed]
- 63. Miller RA, Chrisp C, Galecki A. CD4 memory T cell levels predict life span in genetically heterogeneous mice. FASEB J. 1997; 11:775–83. https://doi.org/10.1096/fasebj.11.10.9271362 [PubMed]
- 64. Lee JS, Ward WO, Ren H, Vallanat B, Darlington GJ, Han ES, Laguna JC, DeFord JH, Papaconstantinou J, Selman C, Corton JC. Meta-analysis of gene expression in the mouse liver reveals biomarkers associated with inflammation increased early during aging. Mech Ageing Dev. 2012; 133:467–78. https://doi.org/10.1016/j.mad.2012.05.006 [PubMed]
- 65. Baker DJ, Childs BG, Durik M, Wijers ME, Sieben CJ, Zhong J. A. Saltness R, Jeganathan KB, Verzosa GC, Pezeshki A, Khazaie K, Miller JD, van Deursen JM. Naturally occurring p16Ink4a-positive cells shorten healthy lifespan. Nature. 2016; 530:184–89. https://doi.org/10.1038/nature16932 [PubMed]
- 66. Coppé JP, Desprez PY, Krtolica A, Campisi J. The senescence-associated secretory phenotype: the dark side of tumor suppression. Annu Rev Pathol. 2010; 5:99–118. https://doi.org/10.1146/annurev-pathol-121808-102144 [PubMed]
- 67. Schubert M, Brazil DP, Burks DJ, Kushner JA, Ye J, Flint CL, Farhang-Fallah J, Dikkes P, Warot XM, Rio C, Corfas G, White MF. Insulin receptor substrate-2 deficiency impairs brain growth and promotes tau phosphorylation. J Neurosci. 2003; 23:7084–92. https://doi.org/10.1523/JNEUROSCI.23-18-07084.2003 [PubMed]
- 68. Smolock EM, Korshunov VA, Glazko G, Qiu X, Gerloff J, Berk BC. Ribosomal protein L17, RpL17, is an inhibitor of vascular smooth muscle growth and carotid intima formation. Circulation. 2012; 126:2418–27. https://doi.org/10.1161/CIRCULATIONAHA.112.125971 [PubMed]
- 69. Cui D, Li L, Lou H, Sun H, Ngai SM, Shao G, Tang J. The ribosomal protein S26 regulates p53 activity in response to DNA damage. Oncogene. 2014; 33:2225–35. https://doi.org/10.1038/onc.2013.170 [PubMed]
- 70. Herndon LA, Schmeissner PJ, Dudaronek JM, Brown PA, Listner KM, Sakano Y, Paupard MC, Hall DH, Driscoll M. Stochastic and genetic factors influence tissue-specific decline in ageing C. elegans. Nature. 2002; 419:808–14. https://doi.org/10.1038/nature01135 [PubMed]
- 71. Kramer B, Buffenstein R. The pancreas of the naked mole-rat (Heterocephalus glaber): an ultrastructural and immunocytochemical study of the endocrine component of thermoneutral and cold acclimated animals. Gen Comp Endocrinol. 2004; 139:206–14. https://doi.org/10.1016/j.ygcen.2004.09.006 [PubMed]
- 72. Harper JM, Durkee SJ, Smith-Wheelock M, Miller RA. Hyperglycemia, impaired glucose tolerance and elevated glycated hemoglobin levels in a long-lived mouse stock. Exp Gerontol. 2005; 40:303–14. https://doi.org/10.1016/j.exger.2005.01.002 [PubMed]
- 73. Mattison JA, Wright C, Bronson RT, Roth GS, Ingram DK, Bartke A. Studies of aging in ames dwarf mice: effects of caloric restriction. J Am Aging Assoc. 2000; 23:9–16. https://doi.org/10.1007/s11357-000-0002-0 [PubMed]
- 74. Masternak MM, Al-Regaiey K, Bonkowski MS, Panici J, Sun L, Wang J, Przybylski GK, Bartke A. Divergent effects of caloric restriction on gene expression in normal and long-lived mice. J Gerontol A Biol Sci Med Sci. 2004; 59:784–88. https://doi.org/10.1093/gerona/59.8.B784 [PubMed]
- 75. Miller RA, Chang Y, Galecki AT, Al-Regaiey K, Kopchick JJ, Bartke A. Gene expression patterns in calorically restricted mice: partial overlap with long-lived mutant mice. Mol Endocrinol. 2002; 16:2657–66. https://doi.org/10.1210/me.2002-0142 [PubMed]
- 76. Withers DJ, Gutierrez JS, Towery H, Burks DJ, Ren JM, Previs S, Zhang Y, Bernal D, Pons S, Shulman GI, Bonner-Weir S, White MF. Disruption of IRS-2 causes type 2 diabetes in mice. Nature. 1998; 391:900–04. https://doi.org/10.1038/36116 [PubMed]
- 77. Hempenstall S, Page MM, Wallen KR, Selman C. Dietary restriction increases skeletal muscle mitochondrial respiration but not mitochondrial content in C57BL/6 mice. Mech Ageing Dev. 2012; 133:37–45. https://doi.org/10.1016/j.mad.2011.12.002 [PubMed]
- 78. Selman C, Kerrison ND, Cooray A, Piper MD, Lingard SJ, Barton RH, Schuster EF, Blanc E, Gems D, Nicholson JK, Thornton JM, Partridge L, Withers DJ. Coordinated multitissue transcriptional and plasma metabonomic profiles following acute caloric restriction in mice. Physiol Genomics. 2006; 27:187–200. https://doi.org/10.1152/physiolgenomics.00084.2006 [PubMed]
- 79. Selman C, Hempenstall S. Evidence of a metabolic memory to early-life dietary restriction in male C57BL/6 mice. Longev Healthspan. 2012; 1:2. https://doi.org/10.1186/2046-2395-1-2 [PubMed]
- 80. Mulvey L, Sands WA, Salin K, Carr AE, Selman C. Disentangling the effect of dietary restriction on mitochondrial function using recombinant inbred mice. Mol Cell Endocrinol. 2017; 455:41–53. https://doi.org/10.1016/j.mce.2016.09.001 [PubMed]
- 81. Johnston SL, Peacock WL, Bell LM, Lonchampt M, Speakman JR. PIXImus DXA with different software needs individual calibration to accurately predict fat mass. Obes Res. 2005; 13:1558–65. https://doi.org/10.1038/oby.2005.191 [PubMed]
- 82. Martin M. Cutadapt removes adapter sequences from high-throughput sequencing reads. EMBnet.journal. 2011; 17:10.
- 83. Joshi NA, Fass JN. Sickle: A sliding-window, adaptive, quality-based trimming tool for FastQ files (Version 1.33 Software). 2011. https://github.com/najoshi/sickle.
- 84. Anders S, Huber W. Differential expression analysis for sequence count data. Genome Biol. 2010; 11:R106. https://doi.org/10.1186/gb-2010-11-10-r106 [PubMed]
- 85. Goff LA, Trapnell C, Kelley D. CummeRbund: Visualization and Exploration of Cufflinks High-throughput Sequencing Data. 2014. .
- 86. Falcon S, Gentleman R. Using GOstats to test gene lists for GO term association. Bioinformatics. 2007; 23:257–58. https://doi.org/10.1093/bioinformatics/btl567 [PubMed]
- 87. Khatri P, Done B, Rao A, Done A, Draghici S. A semantic analysis of the annotations of the human genome. Bioinformatics. 2005; 21:3416–21. https://doi.org/10.1093/bioinformatics/bti538 [PubMed]