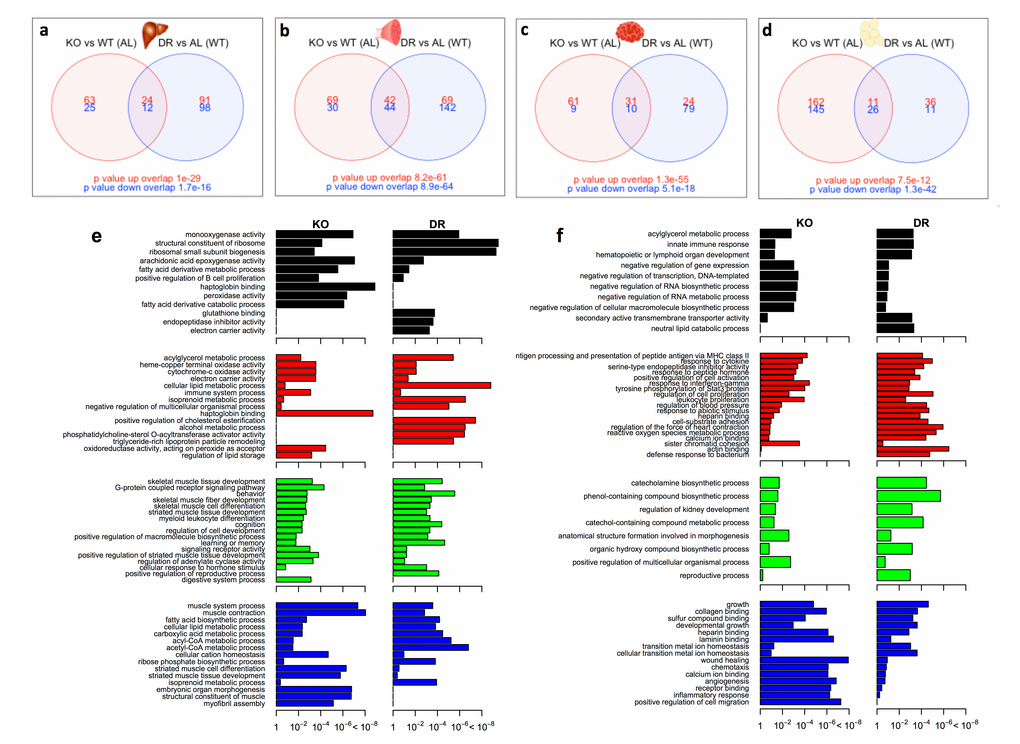
Figure 4.Shared and distinct gene expression profile between KOAL and WTDR mice. Venn diagram of similar and separate expressed genes across (a) liver, (b) skeletal muscle, (c) brain and (d) WAT. Significantly up-regulated genes are shown in red and significantly down-regulated genes are shown in blue. Common genes that are significantly up- or down-regulated are found in overlapping circles. The numbers in the bottom far right denotes the number of genes expressed but not significantly up-regulated (red) or down-regulated (blue). (e) Up-regulated gene ontology (GO) terms in liver (black), skeletal muscle (red), brain (green) and WAT (blue) shared between KOAL and WTDR mice. (f) Down- regulated GO terms in liver, skeletal muscle, brain and WAT shared between KOAL and WTDR mice.