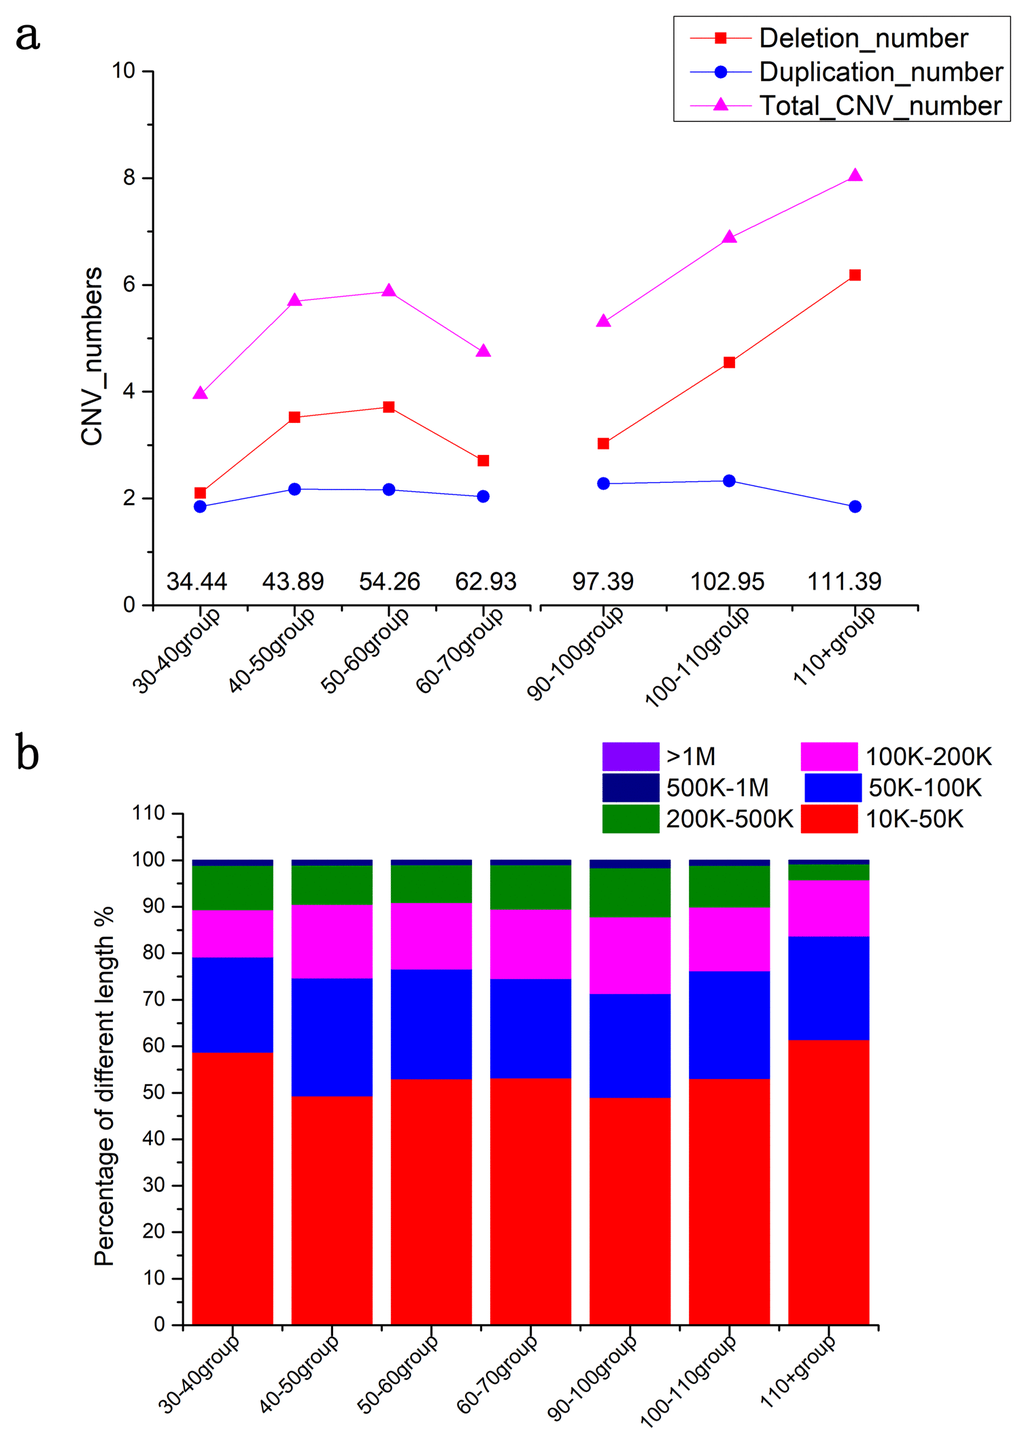
Figure 1.CNV burden in different age groups. (a) The numbers of CNVs in different age groups. (b) The added lengths of CNVs in different age groups. Triangles represent the numbers of the CNVs. The areas in each histogram represent the percentage of different lengths. * p<0.05 by t-test.