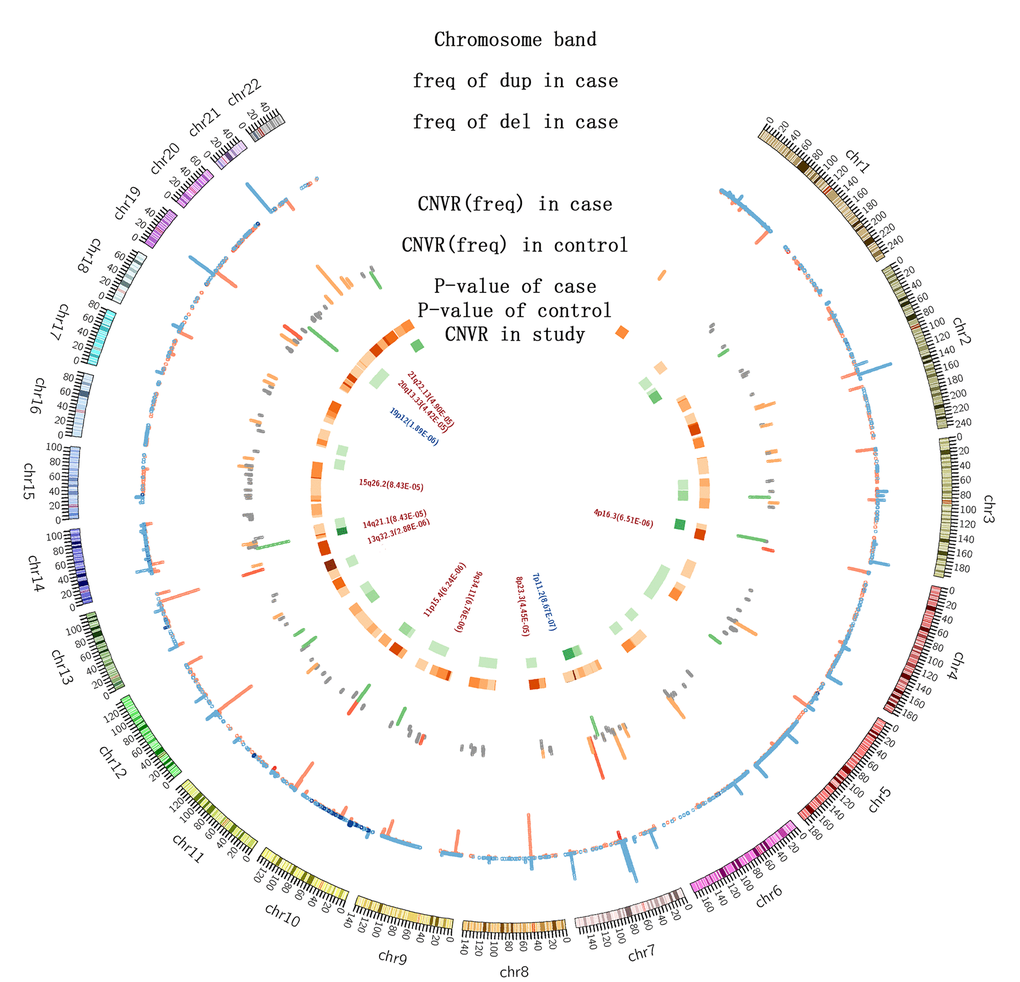
Figure 2.The distribution of CNVs among 4007 individuals. The first circle indicates the positions of chromosomal bands; the second is a histogram representing the frequencies of CNVs in long-lived individuals (red: deletions; blue: duplications; height: CNV frequencies); the third is also a histogram showing the CNV frequencies in the long-lived (orange) and middle-aged (orange) individuals. Frequency: orange and green, >1%; grey, <1%; red, the validated CNVRs by qPCR. The heatmap shows the p-values of CNVRs: orange for the long-lived, green for the middle-aged, and the color gradience towards dark indicates decreasing p-values. The text presents the names of the CNVRs identified in this study.