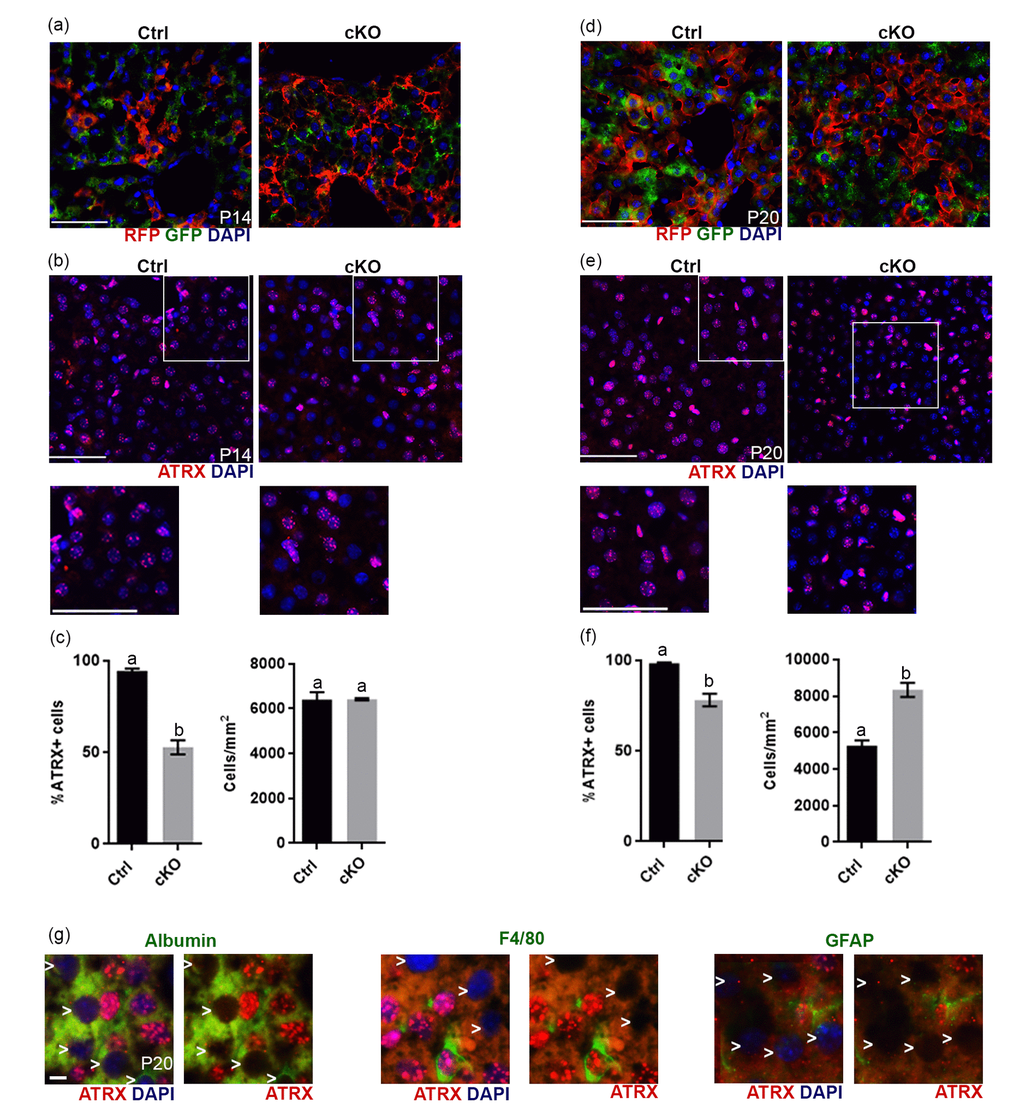
Figure 5.Evidence of Cre recombinase expression and Atrx deletion in a subset of hepatocytes in Atrx Foxg1cre (cKO) mice at P14 and P20. (a) Immunofluorescence detection of RFP and GFP in Atrx Foxg1cre;ROSAmT/mG mice reveals Cre-mediated GFP expression (b) ATRX immunofluorescence of liver cryosections at P14 shows that many nuclei do not express ATRX protein. White box outlines magnified area below. Scale bar = 50 µm. Representative image of n=3 Ctrl/cKO pairs. (c) Cell counts of ATRX+ cells reveal a significant reduction in the proportion of ATRX+ cells in Atrx Foxg1cre compared to control liver at P14 despite equal number of cells. (d) Immunofluorescence detection of RFP and GFP in P20 liver of Atrx Foxg1cre; ROSAmT/mG mice shows expression of shows Cre-mediated GFP expression. (e) ATRX staining in liver cryosections at P20 shows presence of ATRX-null nuclei and the accumulation of bright ATRX+ cells. White box outlines magnified area below. Scale bar = 50 µm. (Representative images from n=3 Ctrl/cKO pairs). (f) Cell counts show a significant reduction in the proportion of ATRX+ cells and increased total cell density in Atrx Foxg1cre liver at P20 compared to controls (g) Immunofluorescence staining of P20 Atrx Foxg1cre liver shows that cells lacking ATRX co-stain with albumin (hepatocytes) but not with F4/80 (Kupffer cells) or GFAP (stellate cells). White arrows point to ATRX-null nuclei. Scale bar = 5 µm. Original magnification, 40x. In graphs (c) and (f), groups with the same letter have means that are not significantly different and groups with different letters have means that are significantly different (p<0.05). Error bars represent SEM.