


Introduction
The α-Thalassemia/mental retardation X-linked (ATRX) chromatin remodeler is a component of constitutive heterochromatin [1-5] and is exclusively nuclear [4]. The C-terminus of ATRX contains a Switch/Sucrose non-fermenting (Swi/Snf) domain [6] which confers the ATPase and translocase activity of ATRX necessary for nucleosome remodelling [7]. The N-terminus of ATRX contains an ADD domain (ATRX-DNTM3-DNTM3L) with homology to the
DNA methyltransferase family and is capable of binding methylated histone tails within chromatin [8].
ATRX is essential for heterochromatin [5,9] and telomere integrity [9,10], as well as normal gene expression [11-15]. Deletion of ATRX in neuroprogenitor cells (NPCs) causes DNA damage at telomeres and pericentromeric heterochromatin [10]. We have previously shown that telomestatin-mediated stabilization of G-quadruplexes exacerbated DNA damage and decreased viability of NPCs in the absence of ATRX [10]. ATRX may be facilitating the progression of DNA replication and transcriptional machinery through these non-canonical DNA structures [10,12].
We previously reported that postnatal health and longevity are severely affected in mice with forebrain and anterior pituitary-specific deficiency for ATRX (Atrx_Foxg1cre) [10]. Many of the abnormalities detected in these mice resemble those previously reported in mouse models of progeria, including low circulating levels of IGF-1 [16-20]. Progeroid syndromes are a group of disorders characterized by accelerated physiological aging. These heritable disorders produce signs of premature aging in many, but not all tissues and therefore are termed segmental progerias. It has been postulated that in progeroid syndromes, mutations in genome repair genes result in increased genomic and heterochromatin instability [21,22]. This is paired with the downregulation of genes involved in growth, such as Igf1, presumably in order to survive the damage [23]. However, if this occurs during development, it is detrimental to the organism, resulting in metabolic defects and premature aging. Several progeroid syndromes have been described, such as Cockayne syndrome [24], Werner syndrome [25] and Hutchinson-Gilford progeria [26]. Symptoms of these disorders typically include reduced growth, decreased lifespan, bone and organ abnormalities and loss of subcutaneous fat.
The role of insulin signalling in aging and longevity is highly conserved [27]. IGF-1 is predominantly produced by the liver and important for stem cell proliferation in many organs and some evidence points to depleted stem cell pools as a main cause of aging [28,29]. A case in point is Hutchinson-Gilford progeria, which is caused by mutations in Zmpste24, a metallopeptidase involved in the processing of lamin A [19]. When lamin A is mutated, the nuclear membrane is unable to form properly, resulting in DNA damage and genome instability [19]. Zmpste24 null mice exhibit accelerated aging phenotypes and low levels of circulating IGF-1 [19]. Remarkably, treatment of these mice with IGF-1 results in amelioration of aging features and extends lifespan, demonstrating that reduction of IGF-1 levels is a cause rather than an effect of premature aging [19].
Xing et al. (2012) showed that mice deficient in thyroid hormone also exhibit premature aging phenotypes associated with greater than 50% decrease in Igf1 expression in liver and bone [30]. In this case, treatment with both the prohormone thyroxine (T4) and the active hormone triiodothyronine (T3) rescued IGF-1 levels as well as the phenotypic defects [30]. Thyroid hormone mediated gene expression is regulated through the binding of T3 to the thyroid hormone receptors (Thrs). Thrs act as transcription factors to either enhance or repress transcription depending on whether T3 is bound or not [31,32]. Moreover, Visser et al. (2016) reported suppressed thyroid hormone signaling and increased expression of the thyroid hormone deactivating enzyme deiodinase 3 (Dio 3) in mouse models of Xeroderma pigmentosa, Cockayne syndrome and in wild type aged mice [33]. Taken together, this evidence suggests that thyroid hormone signalling is implicated in progeria through the regulation of IGF-1 in early postnatal development.
Given that the Atrx Foxg1cre mice exhibit signs of accelerated aging as well as reduced levels of T4 and IGF-1, we hypothesized that T4 treatment could rescue abnormalities in these mice and perhaps extend longevity. Our findings demonstrate that, contrary to our expectation, T4 administration does not rescue IGF-1 serum levels nor the associated adverse phenotypes. Upon further investigation, we found that Atrx is partially deleted in the liver of Atrx Foxg1Cre mice and is required for the expression of a subset of thyroid hormone responsive genes, including Igf1, providing a potential explanation for the lack of rescue in this model system.
Results
T4 administration does not improve body growth of Atrx Foxg1cre mice
We previously reported that Atrx Foxg1cre mice have reduced weight, length and a very short lifespan associated with low T4 and IGF-1 [10]. To test whether T4 injections in the postnatal period might ameliorate deleterious outcomes in these mice, we established a protocol consisting of daily injections of three different doses of L-thyroxine (T4) or PBS as a control, based on Xing et al. 2012 [30]. Cohorts of Atrx Foxg1cre (indicated as cKO in figures) and control mice (indicated as Ctrl in figures) were injected subcutaneously with 0.1, 0.5 or 1.0 mg/kg T4 daily from birth to P14. Atrx Foxg1cre mice injected with T4 did not show lifespan extension at any dose of T4 (Figure 1A). Furthermore, injection protocols with 0.5 and 1.0 mg/kg resulted in decreased average lifespan compared to Atrx Foxg1cre mice + PBS (Figure 1A and Supplementary Figure 1). We thus used the lowest dose of T4 (0.01 mg/kg) for subsequent analyses. We confirmed that at this lower dose, T4 levels were restored to control levels and were significantly increased compared to sham-treated Atrx Foxg1cre mice (Figure 1B). If T4 levels in Atrx Foxg1cre mice differed from the control mean by more than 2 standard deviations, they were considered biological outliers and removed from the study (Supplementary Figure 2A). In order to determine whether serum T3 (the active form of thyroid hormone) was increased after T4 treatment in Atrx Foxg1cre mice, a T3 ELISA was performed (Supplementary Figure 2B). However, due to the low levels of T3 in the serum (1 ng/mL) we were unable to detect a change in any of the groups at this low level.
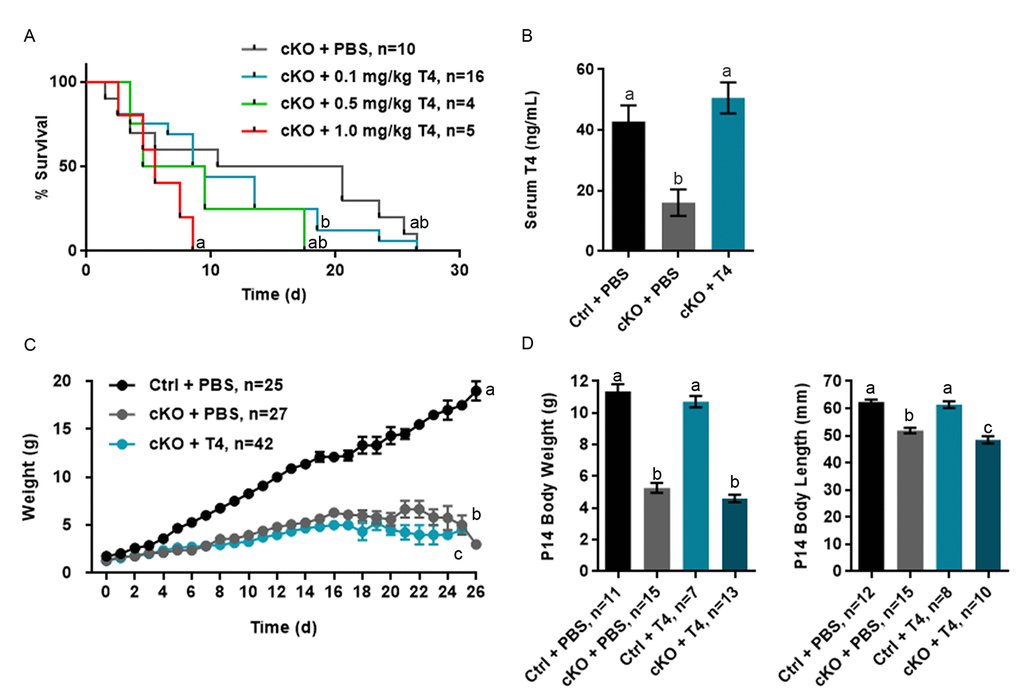
Figure 1. T4 administration restores normal serum T4 levels in Atrx Foxg1cre (cKO) mice but does not rescue life span or growth abnormalities. (a) Kaplan-Meier curve depicting survival of Atrx Foxg1cre mice injected with various amount of T4 from P0-P14 (b) Serum T4 levels are restored in P14 Atrx Foxg1cre mice after T4 treatment (0.1 mg/kg T4). T4 treatment does not improve body size (c) or body weight and length (d) in Atrx Foxg1cre at P14. Groups with the same letter have means that are not significantly different. Groups with different letters have means that are significantly different (p<0.05). Error bars represent SEM.
As previously reported, we observed that the weight of PBS-injected Atrx Foxg1cre mice was significantly lower than PBS-injected control mice over time and this effect was not rescued following T4 treatment (Figure 1C). Weight and length measurements at P14 show that both PBS- or T4-injected Atrx Foxg1cre mice weigh less than half of controls and are shorter in length (Figure 1D). These results indicate that, contrary to our expectation, restoration of normal circulating T4 levels in Atrx Foxg1cre mice failed to improve their reduced size and short lifespan.
Low subcutaneous fat and blood glucose are not improved by T4 administration
The Atrx Foxg1cre mice were previously reported to have very low levels of subcutaneous fat and serum glucose [10]. To measure the effects of T4 injections on these parameters, we examined skin sections and blood taken from P20 Atrx Foxg1cre mice treated with PBS or T4. These analyses confirmed our previous findings that subcutaneous fat thickness was significantly reduced in Atrx Foxg1cre mice compared to controls; however, it was not improved in T4-treated Atrx Foxg1cre mice and appears to be further reduced (Figure 2A). In contrast, thickness of the dermal layer was not affected by the deletion of Atrx or T4 treatment. A similar outcome was observed with serum glucose level, which was significantly decreased in both PBS- and T4-treated Atrx Foxg1cre mice compared to control mice (Figure 2B). Additionally, the liver and spleen of PBS-treated Atrx Foxg1cre mice were decreased in size when compared to control. Upon T4 treatment, we observed a slight increase in liver and spleen weights (relative to body weight) in Atrx Foxg1cre mice, but it was not significantly different from either PBS treated or control mice (Supplementary Figure 3). At P20, heart weight was unchanged in Atrx Foxg1cre treated with PBS compared to control, however following treatment with T4, heart weight increased significantly (Supplementary Figure 3). In summary, subcutaneous fat and serum glucose levels were not rescued by T4 treatment in Atrx Foxg1cre mice.
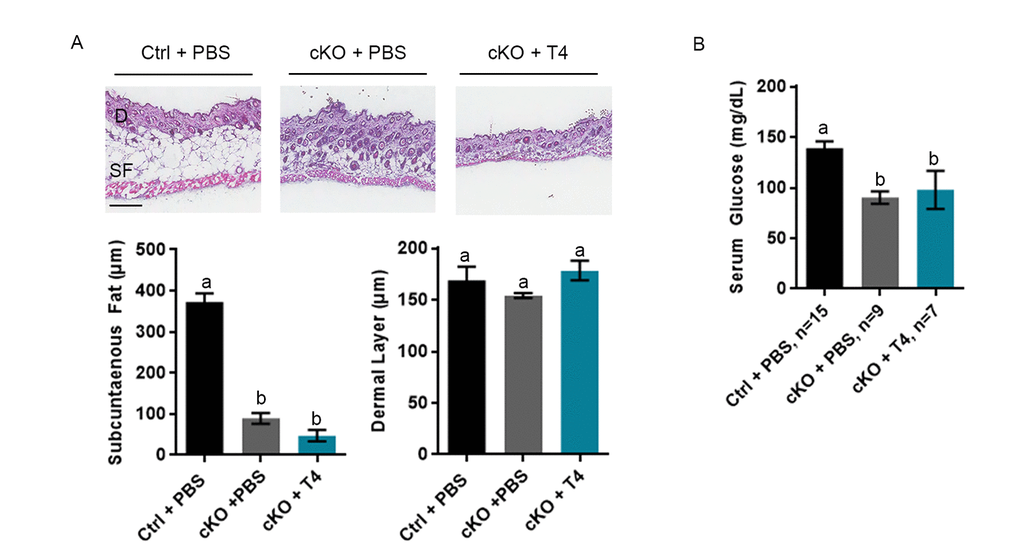
Figure 2. Low subcutaneous fat or serum glucose are not rescued by T4 administration in Atrx Foxg1cre (cKO) mice. (a) H & E staining of P20 skin cryosections shows that subcutaneous fat (SF) is not restored to control levels in Atrx Foxg1cre mice following T4 treatment (n=3). Dermal layer (D) was unchanged between control and either PBS or T4 treated Atrx Foxg1cre mice as previously reported (Scale bar = 200 µm). (b) Serum glucose at P14 was not restored to control levels in Atrx Foxg1cre mice following T4 treatment. Groups with the same letter have means that are not significantly different. Groups with different letters have means that are significantly different (p<0.05). Error bars represent SEM.
T4 administration fails to recover circulating and hepatic IGF-1 levels
We confirmed that Atrx Foxg1cre serum IGF-1 level at P14 is 17.7% that of control mice (Figure 3A). However, recovery of normal T4 circulating levels did not result in the expected increase of serum IGF-1. Given that the liver is the major source of circulating IGF-1, we next examined liver Igf1 expression by quantitative reverse transcriptase PCR (RT-qPCR) and found that Igf1 expression is significantly decreased in the liver of Atrx Foxg1cre mice, even after T4 supplementation (Figure 3A).
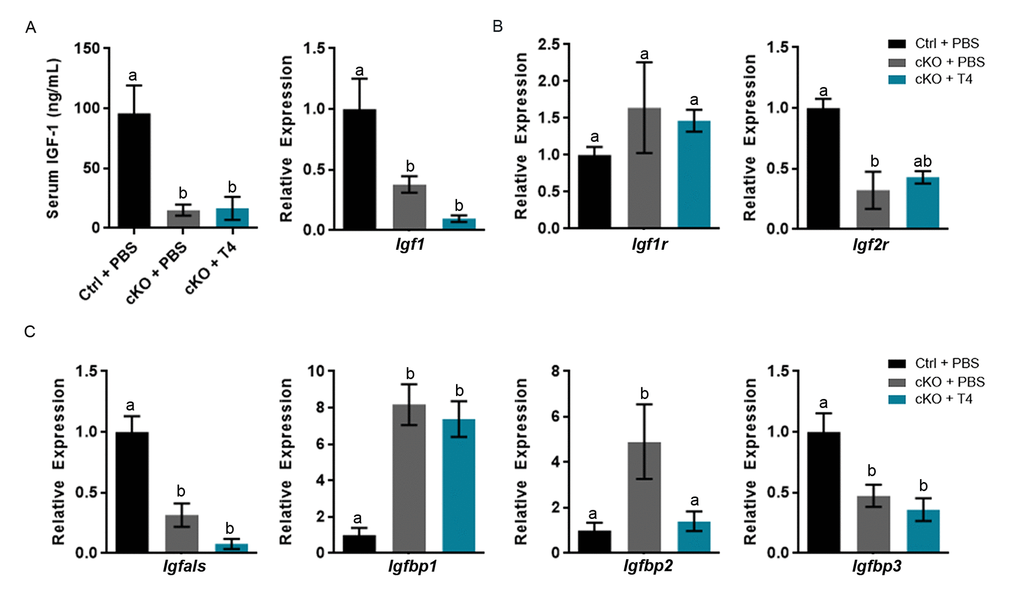
Figure 3. Altered gene expression and serum IGF-1 levels are not ameliorated by T4 administration (cKO) mice at P14. (a) Serum IGF-1 and expression of liver Igf1 are not restored to control levels following T4 treatment in Atrx Foxg1cre mice. (b) qRT-PCR of Igfr and Igf2r expression following T4 treatment in Atrx Foxg1cre mice. (c) Igfals,Igfbp1, Igfbp2 and Igfbp3 (IGF-1 complex proteins) transcript levels in the liver upon T4 treatment. qRT-PCR was normalized to β-actin expression, n=3-6. Groups with the same letter have means that are not significantly different. Groups with different letters have means that are significantly different (p<0.05). Error bars represent SEM.
The decrease in serum IGF-1 in Atrx Foxg1cre mice could be due to alterations in Igf1 receptor (Igf1r) or Igf2 receptor (Igf2r) expression. IGF-1 binds Igf1r, which elicits an intracellular response, whereas Igf2r acts as a scavenger receptor and no response occurs. While Igf1r expression is not altered in the liver, Igf2r expression is decreased in the Atrx Foxg1cre compared to control as previously reported [10] and not recovered by T4 treatment (Figure 3B). These data provide evidence that IGF-1 is able to bind Igf1r and is not subject to deactivation by high levels of Igf2r.
Serum IGF-1 could also be decreased due to gene expression alterations in IGF binding proteins (IGFBPs) and acid labile subunit (IGFALS). Both IGFALS and IGFBPs bind IGF-1, enhancing or diminishing IGF-1 signaling depending on the need of the cell. Igfals and Igfbps are aberrantly expressed in livers of Atrx Foxg1cre mice compared to controls. Igfals expression is significantly decreased in Atrx Foxg1cre mice + PBS compared to control and is not rescued by T4 treatment. Igfbp1 and Igfbp2 expression are significantly increased in Atrx Foxg1cre compared to control mice. Igfbp2, but not Igfbp1 expression is restored to control levels in Atrx Foxg1cre + T4. Low Igfbp2 expression has been reported in hypothyroidism and its increase in expression is likely due to a feedback mechanism following increased serum T4. Igfbp3 expression is decreased in the Atrx Foxg1cre + PBS and not restored to control levels following T4 treatment (Figure 3C) These results indicate that despite restoring serum T4 levels, most genes involved in IGF-1 signalling are still aberrantly expressed.
T4 administration restores thyroxine binding globulin gene expression and a subset of thyroid hormone responsive genes in the liver of Atrx Foxg1cre mice
Alterations in the gene Serpina7 (thyroxine binding globulin (TBG)), one of the thyroid hormone transport molecules, could also affect transport of T4. Serpina7 is significantly increased in the Atrx Foxg1cre + PBS and is restored to control levels following treatment with T4 (Figure 4A). We next examined the effect of T4 injections on the expression of several thyroid hormone target genes in the liver of Atrx Foxg1cre mice. Dio1, which converts T4 to its active form T3, is expressed at slightly decreased levels in Atrx Foxg1cre liver, however not significantly. Dio3, the enzyme which converts T3 to the inactive forms rT3 and T2, is normally expressed embryonically when precise control over thyroid hormone signalling is crucial. Dio3 was reported to be reactivated in the liver of two mouse models of premature aging and in normal mouse aging [33]. Dio3 is slightly increased in Atrx Foxg1cre mice compared to control, however not significantly (Figure 4B). Following T4 treatment Dio3 expression is highly repressed and is significantly decreased in Atrx Foxg1cre mice + T4 compared to Atrx Foxg1cre mice + PBS, suggesting that T4 is converted to the T3 active form. Thyroid hormone receptor β (Thrβ), the active thyroid hormone receptor in the liver, is decreased in the Atrx Foxg1cre + PBS compared to control. When treated with T4, Thrβ expression is restored to control levels and is significantly increased compared to Atrx Foxg1cre + PBS (Figure 4B).
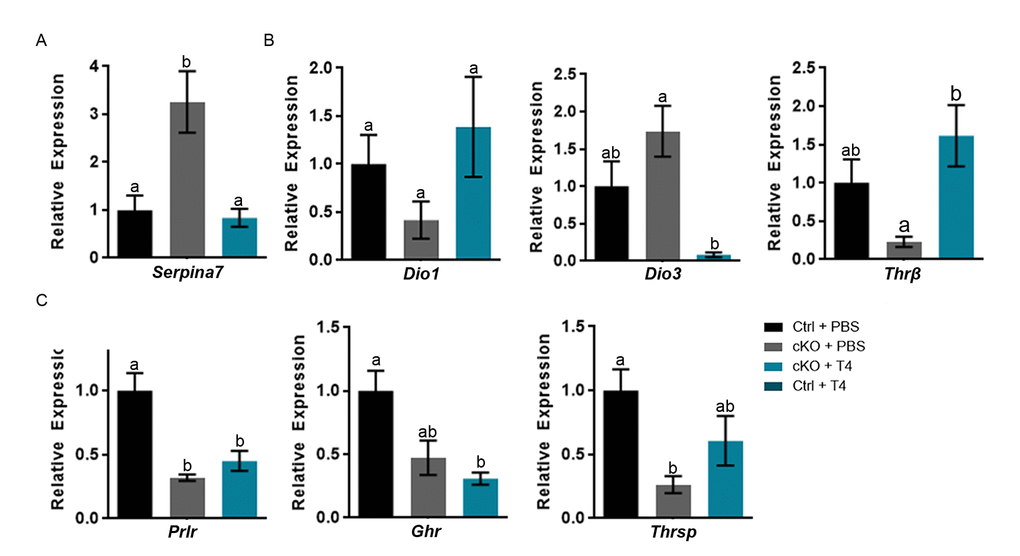
Figure 4. T4 administration restores thyroxine binding globulin gene expression and a subset of thyroid hormone responsive genes in the liver of Atrx Foxg1cre (cKO) mice at P14. (a) Serpina7 (thyroxine binding globulin) gene expression is restored following T4 treatment. (b) Administration of T4 restores thyroid hormone responsive gene expression of Dio1 and Thrβ in Atrx Foxg1cre mice to that of control mice. In addition, there is a dramatic repression of Dio3 expression in the liver of Atrx Foxg1cre mice at P14. (c) Despite normal expression of Thrβ, some thyroid hormone responsive genes are not rescued following T4 treatment in Atrx Foxg1cre mice. qRT-PCR data were normalized to β-actin expression, n=3-6. Groups with the same letter have means that are not significantly different. Groups with different letters have means that are significantly different (p<0.05). Error bars represent SEM.
Despite proper regulation and activation of thyroid hormone in the liver, expression of thyroid hormone responsive genes Prlr, Ghr and Thrsp were not restored to control levels in Atrx Foxg1cre mice treated with T4 (Figure 4C). While the liver of Atrx Foxg1cre mice should essentially be normal, all these results suggested that this is not the case and that it fails to respond to normal thyroid hormone signalling. This prompted us to investigate the possibility that Foxg1Cre expression might be spuriously activated in the liver of these mice, causing Atrx gene inactivation.
Cre recombinase expression and Atrx deletion in the liver of Atrx Foxg1cre mice
We had previously verified by western blot analysis that ATRX protein levels were normal in the liver in P20 Atrx cKO mice [10]. However, given the results above, we re-examined the status of ATRX in the liver. To achieve this, we introduced the ROSAmT/mG reporter allele into the Atrx Foxg1cre mice to allow immunofluorescent detection of Cre-recombinase activity through the detection of green fluorescent protein (GFP), while cells that have never been exposed to Cre-recombinase activity display red fluorescent protein (RFP). Immunofluorescence detection of RFP and GFP in liver cryosections at either P14 (Figure 5A) or P20 (Figure 5D) in Atrxwt/Y; Foxg1cre; Rosa mTmG (controls) and Atrxf/Y;Foxg1cre;Rosa mTmG (cKO) mice revealed the presence of many GFP+ cells in the liver. To verify that this resulted in loss of ATRX protein, we performed immunofluorescence staining of ATRX in liver cryosections at either P14 (Figure 5B) or P20 (Figure 5E). Quantification revealed a significant reduction in the proportion of cells that express ATRX in the liver of Atrx Foxg1cre mice compared to controls at both P14 (Figure 5C) and P20 (Figure 5F). These results indicate that Cre-mediated Atrx inactivation occurred in the liver of Atrx Foxg1cre mice. However, at P20, we noted an increase in the total number of cells in the Atrx Foxg1cre liver, and that many oblong-shaped cells expressed high levels of ATRX when compared to control (Figure 5F). We speculate that these cells represent a regenerative event mediated by proliferating ATRX+ Kupffer or stellate cells, likely explaining the lack of difference in the levels of ATRX protein previously observed in the P20 liver of Atrx Foxg1cre mice by Western blot analysis [10]. Immunofluorescence detection of ATRX and either albumin (hepatocyte marker), F4/80 (Kupffer cell marker) or GFAP (stellate cell marker) in Atrx Foxg1cre mice revealed that cells lacking ATRX co-express albumin but not F4/80 or GFAP, indicating that Cre-mediated Atrx deletion occurs in hepatocytes (Figure 5G).
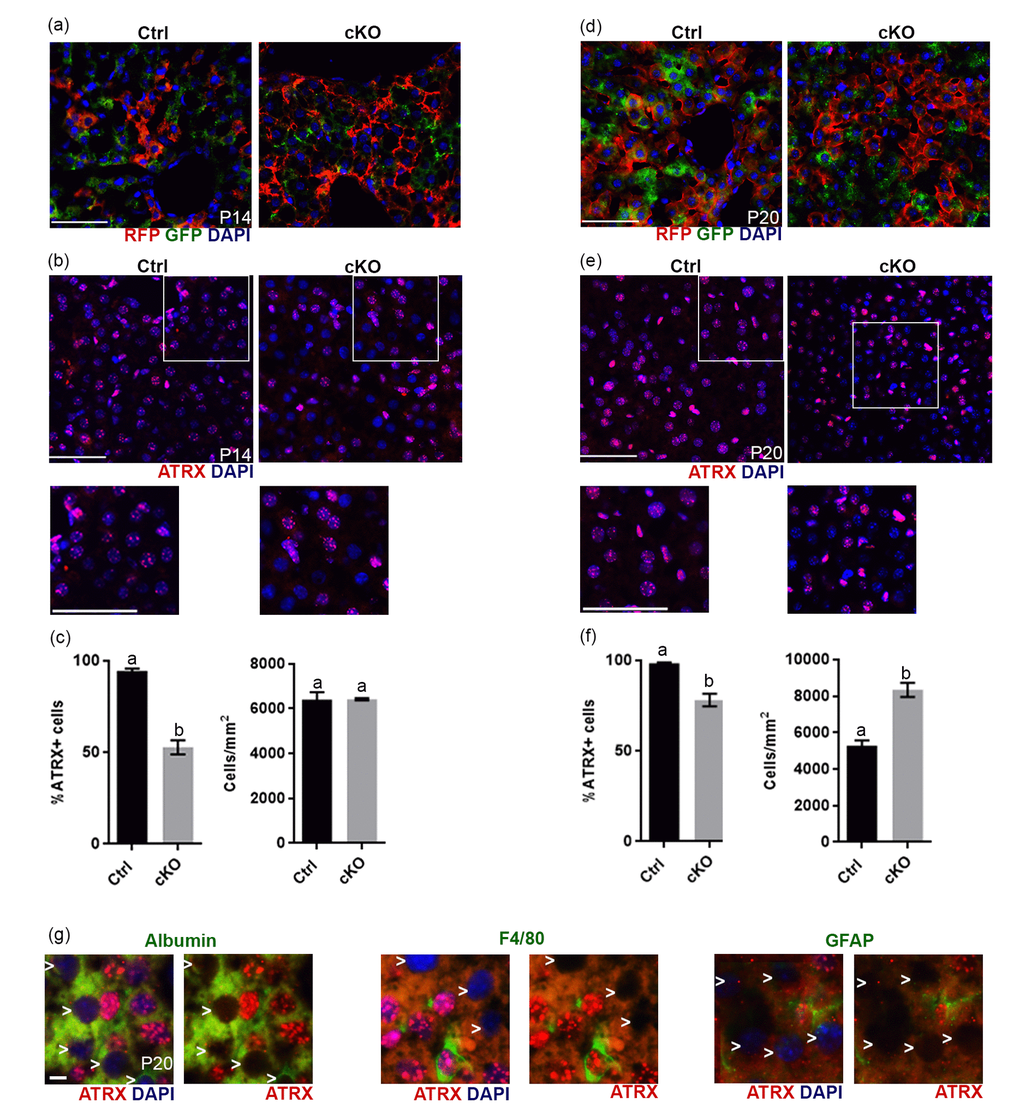
Figure 5. Evidence of Cre recombinase expression and Atrx deletion in a subset of hepatocytes in Atrx Foxg1cre (cKO) mice at P14 and P20. (a) Immunofluorescence detection of RFP and GFP in Atrx Foxg1cre;ROSAmT/mG mice reveals Cre-mediated GFP expression (b) ATRX immunofluorescence of liver cryosections at P14 shows that many nuclei do not express ATRX protein. White box outlines magnified area below. Scale bar = 50 µm. Representative image of n=3 Ctrl/cKO pairs. (c) Cell counts of ATRX+ cells reveal a significant reduction in the proportion of ATRX+ cells in Atrx Foxg1cre compared to control liver at P14 despite equal number of cells. (d) Immunofluorescence detection of RFP and GFP in P20 liver of Atrx Foxg1cre; ROSAmT/mG mice shows expression of shows Cre-mediated GFP expression. (e) ATRX staining in liver cryosections at P20 shows presence of ATRX-null nuclei and the accumulation of bright ATRX+ cells. White box outlines magnified area below. Scale bar = 50 µm. (Representative images from n=3 Ctrl/cKO pairs). (f) Cell counts show a significant reduction in the proportion of ATRX+ cells and increased total cell density in Atrx Foxg1cre liver at P20 compared to controls (g) Immunofluorescence staining of P20 Atrx Foxg1cre liver shows that cells lacking ATRX co-stain with albumin (hepatocytes) but not with F4/80 (Kupffer cells) or GFAP (stellate cells). White arrows point to ATRX-null nuclei. Scale bar = 5 µm. Original magnification, 40x. In graphs (c) and (f), groups with the same letter have means that are not significantly different and groups with different letters have means that are significantly different (p<0.05). Error bars represent SEM.
Increased expression of subset of thyroid hormone responsive genes upon T4 administration require ATRX expression
Several thyroid hormone responsive genes (Igf1, Prlr, Ghr and Thrsp) failed to respond to T4 treatment in Atrx Foxg1cre mice, suggesting that their induction by T4 might require ATRX. To test this, we compared the effect of T4 treatment of control and Atrx FoxG1cre mice on the expression of Igf1, Prlr, Ghr and Thrsp in the liver. The results show that these thyroid hormone responsive genes are induced by T4 in control mice, but not in Atrx mutants (Figure 6), confirming a dependence on ATRX (Figure 7).
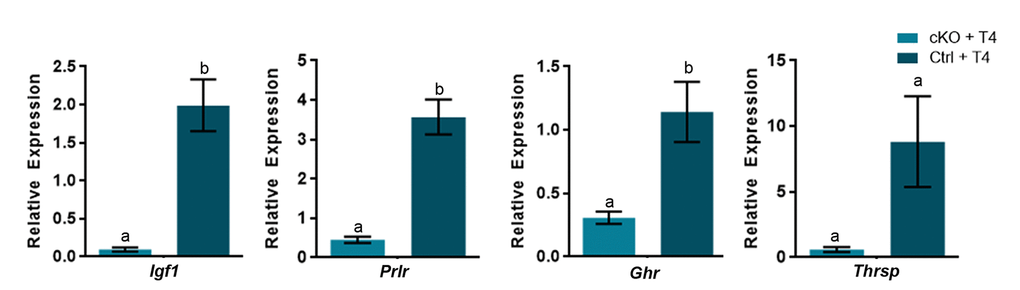
Figure 6. A subset of thyroid hormone responsive genes are induced in the P14 liver in the presence of excess T4, in an ATRX-dependent manner. Administration of T4 induces gene expression at or above the level of controls treated wtih PBS (control set to 1) only when ATRX is present in Ctrl + T4 mice and not in Atrx FoxG1cre (cKO) + T4 mice at P14. qRT-PCR data were normalized to β-actin expression, n=3-6. Groups with the same letter have means that are not significantly different. Groups with different letters have means that are significantly different (p<0.05). Error bars represent SEM.
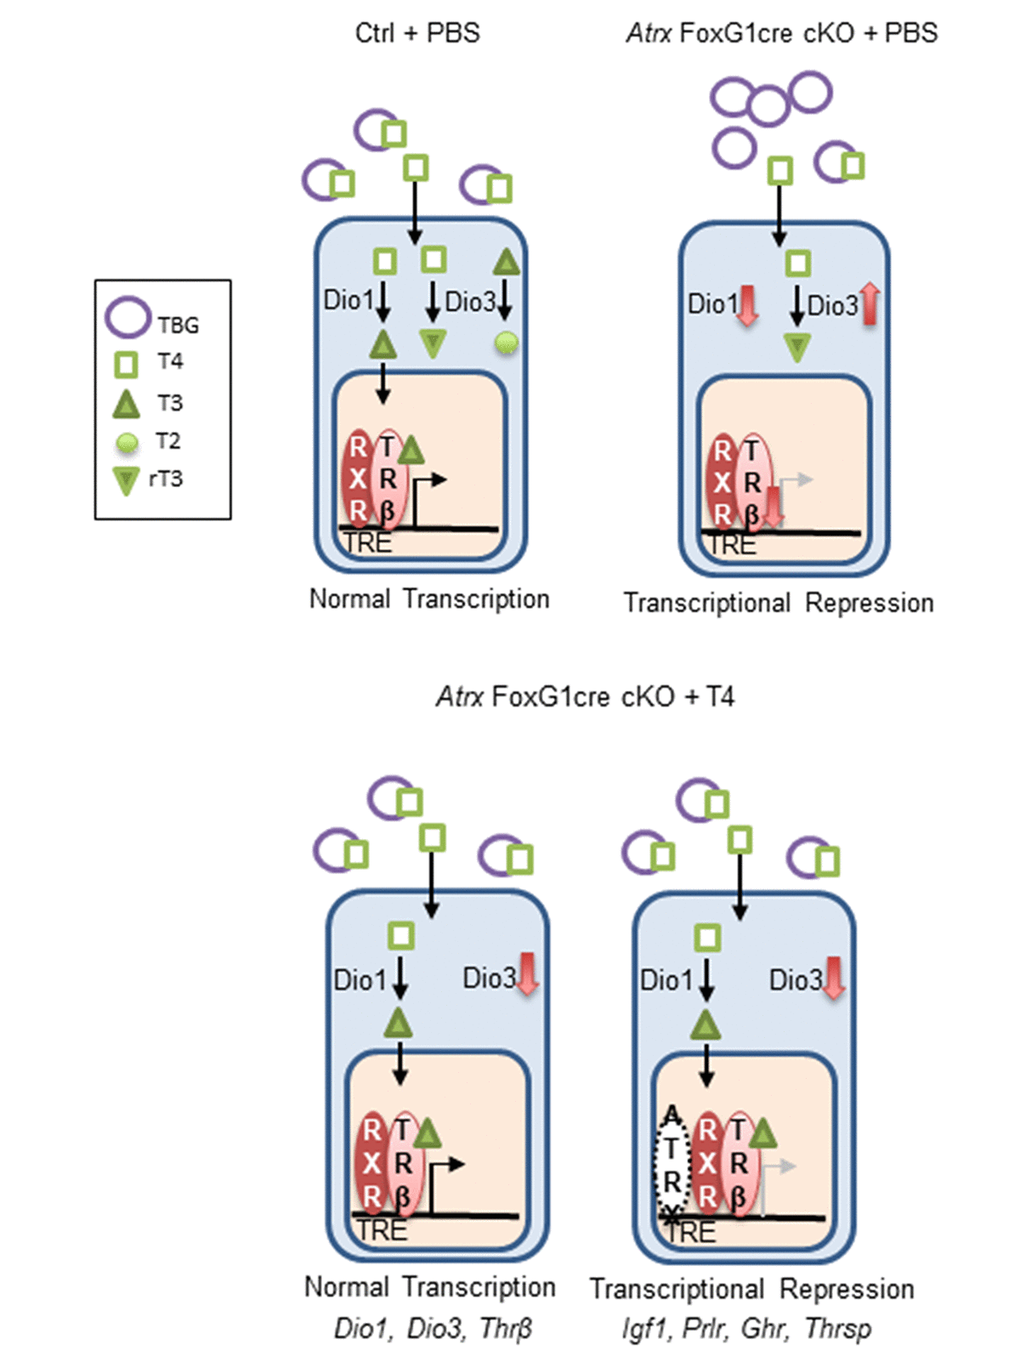
Figure 7. ATRX is required for the transcription of several thyroid hormone responsive genes in the liver. In the control, T4 is bound to thyroxine binding globulin (TBG) in the blood. It is converted to T3 in the liver by Dio1. Both T4 and T3 can be inactivated by Dio3 to produce the inactive molecules T2 and rT3. T3 binds its receptor Thrβ (found as a heterodimer with retinoid x receptor), which enters the nucleus, binds a thyroid hormone responsive element and initiates transcription. In Atrx Foxg1cre mice there is an increase in TBG and a decrease in T4 in the serum. In the liver, there is a decrease in Dio1 and an increase in Dio3. Any T4 present is likely converted to rT3. Low levels of Thrβ acts as a transcriptional repressor. Following treatment with T4 in Atrx Foxg1cre mice, there are control levels of TBG and T4 in the blood. In the liver, Dio1 is at control levels and Dio3 is repressed. T4 is converted to T3 where it binds its receptor and transcription occurs normally. This occurs for a subset of genes (Dio1, Dio3 and Thrβ). However, some genes (Igf1, Prlr, Ghr and Thrsp) are still transcriptionally repressed following T4 treatment. This suggests that ATRX is required for the transcription of some thyroid hormone responsive genes.
Discussion
Low serum IGF-1 has been implicated as a driver of premature aging syndromes [19,30]. More recently, thyroid hormone signalling suppression has been linked to both premature aging and normal aging in mice [30,33]. Given the previous observation that the Atrx Foxg1cre mice have both low T4 and IGF1 [10], we tested the effects of T4 injections. Despite recovery of normal T4 levels, the signalling that promotes Igf1 expression in the liver defective, likely due to previously unrecognized Cre-mediated inactivation of the Atrx gene in the liver. Thus, while several thyroid hormone target genes were responsive to T4 treatment, several others, including Igf1, were not, suggesting that ATRX is required for the induction of these genes in the liver. As a result, T4 administration does not rescue decreased lifespan, reduced growth or other defects in Atrx Foxg1cre mice.
Higher doses of T4 that we initially tested (0.5 and 1.0 mg/kg daily) were likely inducing hyperthyroidism in these small, young mice. The lowest dose, 0.1 mg/kg T4 daily, appeared to have variable effects as some Atrx cKO mice injected received well above control levels or levels similar to uninjected Atrx FoxG1cre mice. Whether this was experimental error or Atrx FoxG1cre mice have variable absorption is unknown. Nevertheless, we used only Atrx FoxG1cre mice that expressed control levels of serum T4 after treatment for subsequent analyses. Our results suggest that restoring normal levels of serum T4 in Atrx FoxG1cre mice does not ameliorate premature aging phenotypes. It is known that hyperthyroidism causes increased metabolic rate, reduced bone density and osteoporosis [34]. Due to the small size of the Atrx FoxG1cre mice (46.3% of control weight), it is possible that Atrx FoxG1cre mice received levels of T4 that are too high for their body weight and that a lower dose is necessary to eliminate induction of hyperthyroidism in this model. Since Igf1r appears to be unaffected by deletion of ATRX, a future experiment would be to directly inject IGF-1 in Atrx Foxg1cre mice. It has been shown in a Hutchinson-Gilford Progeria mouse model that IGF-1 treatment extends lifespan and delays onset of premature aging [19].
The inefficacy of T4 treatment in our study could be explained by deletion of Atrx in the liver of Atrx Foxg1cre mice, which was not previously reported. Dio1, Serpina7 and Thrβ transcript levels were normalized by T4 treatment, indicating that hepatic T3 is produced and that thyroid signalling is at least partially intact. Conversely, several thyroid hormone responsive genes including Igf1, Prlr, Ghr and Thrsp were not rescued following T4 treatment. Furthermore, when controls were treated with T4, these genes all increased compared to control levels. These data suggest that ATRX must be required for T3-mediated transcription of a subset of genes in the liver.
It is still unknown why deletion of Atrx in the liver disrupts proper signalling and production of IGF-1. ATRX contains several LXXLL-type motifs required to bind hormone receptors and in the testes, it was shown that ATRX is able to bind the androgen receptor, facilitating transcription of androgen receptor target genes [15]. Therefore, it is possible that ATRX binds and cooperates with the thyroid hormone receptor directly to modulate gene expression in the liver. Moreover, a recent report strongly implicates ATRX in the regulation of gene expression in the liver [35]. It was shown that the nucleotide excision repair (NER) structure-specific endonuclease ERCC1–XPF, a complex that is mutated in premature aging, recruits the CTCF–cohesin complex, MBD2 and ATRX to promoters and imprinting control regions (ICRs) to silence a subset of imprinted genes during hepatic development [35].
ATRX deletion has been shown to result in DNA replication stress and telomere abnormalities [10]. It is also possible that in addition to low levels of IGF-1, DNA damage is accumulating in hepatocytes lacking ATRX and these cells are dying or becoming senescent, further exacerbating low levels of stem cells in the liver. In the future, it will be important to investigate the full extent of ATRX function in the liver and to further explore the link between ATRX and thyroid hormone mediated transcription.
Methods
Mouse husbandry and genotyping
Mice were exposed to 12-hour light/12-hour dark cycles and fed tap water and regular chow ad libitum. The AtrxloxP mice have been described previously [36,37]. AtrxloxP mice, when mated to mice expressing Cre recombinase under the control of the Foxg1 promoter (Foxg1KiCre, RRID:MGI:3767191) [38], produce male progeny with Atrx deficiency in the forebrain and anterior pituitary (AtrxloxP;Foxg1KiCre or Atrx Foxg1cre for simplicity, RRID:MGI:3530074). Ear or tail genomic DNA was used for genotyping. Atrx, Cre, and Sry genotyping was performed by PCR as previously described [36].
Thyroxine injections
Control and Atrx Foxg1cre mice were injected subcutaneously from birth (P0) until P14 with 0.1, 0.5 or 1.0 mg/kg L-thyroxine (T4) (Sigma, T2376-100MG).
Measurements of T4, T3, IGF-1, and glucose
Plasma samples were collected from P14 mice. Blood was collected from the inferior vena cava. EDTA pH 7.0 was added to the blood sample and centrifuged at 10000 RPM for 10 minutes at 4°C. Plasma supernatant was collected and kept frozen at –80°C. Plasma T4 was assayed using a mouse T4 ELISA kit (Calbiotech, T4044T-100) according to the manufacturers’ instructions. Plasma T3 was assayed using a mouse T3 ELISA kit (T3043T-100) according to the manufacturers’ instructions. Plasma IGF-1 content was measured using a mouse IGF-1 ELISA kit (R&D Systems, MG100) according to the manufacturers’ instructions. Blood glucose levels were measured prior to sacrifice using the ReliOn Prime Blood Glucose Meter according to the manufacturer’s instructions.
Hematoxylin and eosin staining of skin sections
P20 mice were perfused with 4% paraformaldehyde before PBS washes and dehydration. Skin tissue was flash-frozen in liquid nitrogen using Cryomatrix (ThermoFisher Scientific) cryoprotectant [39] and sectioned at 8µm (Leica CM 3050S). H&E staining was performed as follows: CAT hematoxylin (Biocare Medical) for 2 minutes, wash for 30 seconds, Tasha’s bluing solution (Biocare Medical) for 30 seconds, wash for 10 minutes, eosin Y (Biocare Medical) for 2 minutes, 70% ethanol for 1 minute, 90% ethanol for 1 min, 100% ethanol for 4 min, Xylene for 15 minutes. Slides were mounted with permount (Fisher Scientific).
Immunofluorescence and antibodies
P14 or P20 mice were perfused with 4% paraformaldehyde before PBS washes and dehydration. Liver tissue was flash-frozen in liquid nitrogen using Cryomatrix (ThermoFisher Scientific) cryoprotectant [39] and sectioned and sectioned at 8µm (Leica CM 3050S). For immunofluorescence staining of cryosections, antigen retrieval was performed on slides by warming 10 mM sodium citrate pH 6 solution to approximately 95°C and microwaving slides in solution for 10 minutes on low. After cooling, slides were washed, blocked with 10% normal goat serum (Sigma-Aldrich) for 1 hour and incubated with primary antibody overnight at 4°C. Slides were washed in PBS and incubated with secondary antibody for 1 hour. Sections were counterstained with DAPI (Sigma-Aldrich) and mounted with permafluor (ThermoFisher Scientific). The following primary antibodies were used: anti-ATRX, rabbit polyclonal (1:75, Santa-Cruz Biotechnology, sc-15408, RRID:AB_2061023), anti-GFP, chicken polyclonal (1:150, ThermoFisher Scientific, PA1-9533, RRID:AB_1074893), anti-RFP, rabbit polyclonal (1:150, Rockland, 600-401-379, RRID:AB_2209751), anti-Albumin, goat polyclonal (1:600, Bethyl, A90-134, RRID:AB_67120), anti-F4/80, rat monoclonal (Abcam, ab6640, RRID:AB_1140040), anti-GFAP, mouse monoclonal (Sigma-Aldrich Cat# G3893, RRID:AB_477010). The secondary antibodies used were goat anti-rabbit-Alexa Fluor 594 (1:800 dilution; ThermoFisher Scientific, A-11012, RRID:AB_2534079), goat anti-chicken-Alexa Fluor 488 (1:800 dilution; ThermoFisher Scientific, A-11039, RRID:AB_2534096), goat anti-mouse-Alexa Fluor 488 (1:800 dilution; ThermoFisher Scientific, A-21121, RRID:AB_2535764) and goat anti-rat-Alexa Fluor 488 (1:800 dilution; Thermo Fisher Scientific, A-11006, RRID:AB_2534074).
Microscopy and imaging
Hematoxalin and eosin images were captured using a scanscope (Aperio CS model, Leica). Scanscope console imaging software was used for automated image capture and processing was performed using Volocity software (PerkinElmer). Immunofluorescence images were captured using an inverted microscope (DMI 6000b, Leica). Digital microscopy images were captured with a digital camera (ORCA-ER, Hamamatsu). Openlab imaging software was used for manual image capture, and processing was performed using Volocity software (PerkinElmer).
Quantitative reverse transcriptase PCR (qRT-PCR)
Total RNA was isolated from liver with the RNeasy Mini Kit (QIAGEN) and reverse transcribed into cDNA as described previously [40]. Control reactions without reverse transcriptase were prepared in parallel. cDNA was amplified with gene-specific primers under the following conditions: 25–35 cycles of 95°C for 30 seconds, 60°C for 30 seconds, and 72°C for 1 minute. For qRT-PCR, cDNA was amplified with iQ SYBR Green Master Mix (Bio-Rad) by using the standard curve Ct method of quantification. Experiments were performed on a Chromo-4 thermocycler (MJ Research) and analyzed with Opticon Monitor 3 and GeneX (Bio-Rad) software. Gene expression analysis was repeated in duplicate for each sample. Conditions for amplification were as follows: 35 cycles of 95°C for 10 seconds, 55°C for 20 seconds, 72°C for 30 seconds, and a final melting curve generated in increments of 0.5°C per plate read. Primer sequences are listed in Table 1.
Table 1. Primer set sequences.
| Gene Name | Forward Primer | Reverse Primer |
| Igf1 | Acc tca gac agg cat tgt gg | gtt tgt cga tag gga cgg gg |
| Igf1r | tgt ggt caa gga tga acc cg | cct tgg gat acc aca ccc ag |
| Igf2r | gca tct ttc cac cag ttc cg | gct cgt cct cat tgt cat cc |
| Igfals | cac aca acg cca tca cta gc | cgt tga aga ggc caa aga ag |
| Igfbp1 | agc cca gag atg aca gag ga | gtt ggg ctg cag cta atc tc |
| Igfbp2 | gcg ggt acc tgt gaa aag ag | aac aca gcc agc tcc ttc at |
| Igfbp3 | gtg acc gat tcc aag ttc ca | tgt cct cca ttt ctc tgc gg |
| Serpina7 | cct tcc aaa aga ggg aca ca | cca agg tca tat gtg gca ga |
| Dio1 | gga cac aat gca gaa cca ga | gca aag ctt ttc cag gac ag |
| Dio3 | gtt ttt ggc ttg ctc tca gg | caa caa gtc cga gct gtg aa |
| Thrβ | cag aac cca cgg atg agg ag | ggc att cac aat ggg tgc tt |
| Prlr | gca tct ttc cag cag ttc cg | gct cgt cct cat tgt cat cc |
| Ghr | att cac caa gtg tcg ttc c | tcc att cct ggg tcc att ca |
| Thrsp | acg gag ccc ctg atc tct at | ggc ttc tag gtc cag ctc ct |
Statistical analysis
Statistical analysis was performed using GraphPad Prism6 software (6.05; GraphPad Software Inc.), and all results are expressed as the mean ± SEM unless indicated otherwise. Two independent data sets were compared with the Student’s t test (unpaired, 2-tailed). Multiple independent data sets were compared with a one-way ANOVA with post-hoc Tukey’s test. Statistical analyses of Kaplan-Meier survival curves were performed using the log-rank test and the Gehan-Breslow-Wilcoxon test. A repeated-measures polynomial modeling analysis (SAS v.9.4, SAS Institute Inc., Cary, NC, USA) was used to compare differences between groups in weight over time. P values of 0.05 or less were considered to indicate significance.
Study approval
All procedures involving animals were conducted in accordance with the regulations of the Animals for Research Act of the Province of Ontario and approved by the University of Western Ontario Animal Care and Use Committee.
Supplementary Materials
Author Contributions
Rowland, Beier and Bérubé designed the study, analyzed and interpreted the data and drafted the manuscript. Rowland and Jiang acquired the data.
Acknowledgements
We thank Dr. Douglas Higgs and Dr. Richard Gibbons (Weatherall Institute of Molecular Medicine, John Radcliffe Hospital, Oxford, UK) for kindly providing the AtrxloxP mice used in this study and Emilie Brûlé for technical support.
Conflicts of Interest
The authors have no conflicts of interest.
Funding
This work was supported by an Ontario Graduate Scholarship to Megan E. Rowland. Operating funds were from the Canadian Institutes for Health Research MOP#142369.
References
- 1. Sadic D, Schmidt K, Groh S, Kondofersky I, Ellwart J, Fuchs C, Theis FJ, Schotta G. Atrx promotes heterochromatin formation at retrotransposons. EMBO Rep. 2015; 16:836–50. https://doi.org/10.15252/embr.201439937 [PubMed]
- 2. Voon HP, Hughes JR, Rode C, De La Rosa-Velázquez IA, Jenuwein T, Feil R, Higgs DR, Gibbons RJ. ATRX Plays a Key Role in Maintaining Silencing at Interstitial Heterochromatic Loci and Imprinted Genes. Cell Reports. 2015; 11:405–18. https://doi.org/10.1016/j.celrep.2015.03.036 [PubMed]
- 3. Goldberg AD, Banaszynski LA, Noh KM, Lewis PW, Elsaesser SJ, Stadler S, Dewell S, Law M, Guo X, Li X, Wen D, Chapgier A, DeKelver RC, et al. Distinct factors control histone variant H3.3 localization at specific genomic regions. Cell. 2010; 140:678–91. https://doi.org/10.1016/j.cell.2010.01.003 [PubMed]
- 4. McDowell TL, Gibbons RJ, Sutherland H, O’Rourke DM, Bickmore WA, Pombo A, Turley H, Gatter K, Picketts DJ, Buckle VJ, Chapman L, Rhodes D, Higgs DR. Localization of a putative transcriptional regulator (ATRX) at pericentromeric heterochromatin and the short arms of acrocentric chromosomes. Proc Natl Acad Sci USA. 1999; 96:13983–88. https://doi.org/10.1073/pnas.96.24.13983 [PubMed]
- 5. Baumann C, Schmidtmann A, Muegge K, De La Fuente R. Association of ATRX with pericentric heterochromatin and the Y chromosome of neonatal mouse spermatogonia. BMC Mol Biol. 2008; 9:29. https://doi.org/10.1186/1471-2199-9-29 [PubMed]
- 6. Picketts DJ, Higgs DR, Bachoo S, Blake DJ, Quarrell OW, Gibbons RJ. ATRX encodes a novel member of the SNF2 family of proteins: mutations point to a common mechanism underlying the ATR-X syndrome. Hum Mol Genet. 1996; 5:1899–907. https://doi.org/10.1093/hmg/5.12.1899 [PubMed]
- 7. Xue Y, Gibbons R, Yan Z, Yang D, McDowell TL, Sechi S, Qin J, Zhou S, Higgs D, Wang W. The ATRX syndrome protein forms a chromatin-remodeling complex with Daxx and localizes in promyelocytic leukemia nuclear bodies. Proc Natl Acad Sci USA. 2003; 100:10635–40. https://doi.org/10.1073/pnas.1937626100 [PubMed]
- 8. Aapola U, Kawasaki K, Scott HS, Ollila J, Vihinen M, Heino M, Shintani A, Kawasaki K, Minoshima S, Krohn K, Antonarakis SE, Shimizu N, Kudoh J, Peterson P. Isolation and initial characterization of a novel zinc finger gene, DNMT3L, on 21q22.3, related to the cytosine-5-methyltransferase 3 gene family. Genomics. 2000; 65:293–98. https://doi.org/10.1006/geno.2000.6168 [PubMed]
- 9. Law MJ, Lower KM, Voon HP, Hughes JR, Garrick D, Viprakasit V, Mitson M, De Gobbi M, Marra M, Morris A, Abbott A, Wilder SP, Taylor S, et al. ATR-X syndrome protein targets tandem repeats and influences allele-specific expression in a size-dependent manner. Cell. 2010; 143:367–78. https://doi.org/10.1016/j.cell.2010.09.023 [PubMed]
- 10. Watson LA, Solomon LA, Li JR, Jiang Y, Edwards M, Shin-ya K, Beier F, Bérubé NG. Atrx deficiency induces telomere dysfunction, endocrine defects, and reduced life span. J Clin Invest. 2013; 123:2049–63. https://doi.org/10.1172/JCI65634 [PubMed]
- 11. Levy MA, Fernandes AD, Tremblay DC, Seah C, Bérubé NG. The SWI/SNF protein ATRX co-regulates pseudoautosomal genes that have translocated to autosomes in the mouse genome. BMC Genomics. 2008; 9:468. https://doi.org/10.1186/1471-2164-9-468 [PubMed]
- 12. Levy MA, Kernohan KD, Jiang Y, Bérubé NG. ATRX promotes gene expression by facilitating transcriptional elongation through guanine-rich coding regions. Hum Mol Genet. 2015; 24:1824–35. https://doi.org/10.1093/hmg/ddu596 [PubMed]
- 13. Li Y, Syed J, Suzuki Y, Asamitsu S, Shioda N, Wada T, Sugiyama H. Effect of ATRX and G-Quadruplex Formation by the VNTR Sequence on α-Globin Gene Expression. ChemBioChem. 2016; 17:928–35. https://doi.org/10.1002/cbic.201500655 [PubMed]
- 14. Ratnakumar K, Duarte LF, LeRoy G, Hasson D, Smeets D, Vardabasso C, Bönisch C, Zeng T, Xiang B, Zhang DY, Li H, Wang X, Hake SB, et al. ATRX-mediated chromatin association of histone variant macroH2A1 regulates α-globin expression. Genes Dev. 2012; 26:433–38. https://doi.org/10.1101/gad.179416.111 [PubMed]
- 15. Bagheri-Fam S, Argentaro A, Svingen T, Combes AN, Sinclair AH, Koopman P, Harley VR. Defective survival of proliferating Sertoli cells and androgen receptor function in a mouse model of the ATR-X syndrome. Hum Mol Genet. 2011; 20:2213–24. https://doi.org/10.1093/hmg/ddr109 [PubMed]
- 16. Niedernhofer LJ, Garinis GA, Raams A, Lalai AS, Robinson AR, Appeldoorn E, Odijk H, Oostendorp R, Ahmad A, van Leeuwen W, Theil AF, Vermeulen W, van der Horst GT, et al. A new progeroid syndrome reveals that genotoxic stress suppresses the somatotroph axis. Nature. 2006; 444:1038–43. https://doi.org/10.1038/nature05456 [PubMed]
- 17. van der Pluijm I, Garinis GA, Brandt RM, Gorgels TG, Wijnhoven SW, Diderich KE, de Wit J, Mitchell JR, van Oostrom C, Beems R, Niedernhofer LJ, Velasco S, Friedberg EC, et al. Impaired genome maintenance suppresses the growth hormone--insulin-like growth factor 1 axis in mice with Cockayne syndrome. PLoS Biol. 2007; 5:e2. https://doi.org/10.1371/journal.pbio.0050002 [PubMed]
- 18. Kanfi Y, Naiman S, Amir G, Peshti V, Zinman G, Nahum L, Bar-Joseph Z, Cohen HY. The sirtuin SIRT6 regulates lifespan in male mice. Nature. 2012; 483:218–21. https://doi.org/10.1038/nature10815 [PubMed]
- 19. Mariño G, Ugalde AP, Fernández ÁF, Osorio FG, Fueyo A, Freije JM, López-Otín C. Insulin-like growth factor 1 treatment extends longevity in a mouse model of human premature aging by restoring somatotroph axis function. Proc Natl Acad Sci USA. 2010; 107:16268–73. https://doi.org/10.1073/pnas.1002696107 [PubMed]
- 20. Varga R, Eriksson M, Erdos MR, Olive M, Harten I, Kolodgie F, Capell BC, Cheng J, Faddah D, Perkins S, Avallone H, San H, Qu X, et al. Progressive vascular smooth muscle cell defects in a mouse model of Hutchinson-Gilford progeria syndrome. Proc Natl Acad Sci USA. 2006; 103:3250–55. https://doi.org/10.1073/pnas.0600012103 [PubMed]
- 21. Shumaker DK, Dechat T, Kohlmaier A, Adam SA, Bozovsky MR, Erdos MR, Eriksson M, Goldman AE, Khuon S, Collins FS, Jenuwein T, Goldman RD. Mutant nuclear lamin A leads to progressive alterations of epigenetic control in premature aging. Proc Natl Acad Sci USA. 2006; 103:8703–08. https://doi.org/10.1073/pnas.0602569103 [PubMed]
- 22. Liu GH, Barkho BZ, Ruiz S, Diep D, Qu J, Yang SL, Panopoulos AD, Suzuki K, Kurian L, Walsh C, Thompson J, Boue S, Fung HL, et al. Recapitulation of premature ageing with iPSCs from Hutchinson-Gilford progeria syndrome. Nature. 2011; 472:221–25. https://doi.org/10.1038/nature09879 [PubMed]
- 23. Garinis GA, Uittenboogaard LM, Stachelscheid H, Fousteri M, van Ijcken W, Breit TM, van Steeg H, Mullenders LH, van der Horst GT, Brüning JC, Niessen CM, Hoeijmakers JH, Schumacher B. Persistent transcription-blocking DNA lesions trigger somatic growth attenuation associated with longevity. Nat Cell Biol. 2009; 11:604–15. https://doi.org/10.1038/ncb1866 [PubMed]
- 24. Karikkineth AC, Scheibye-Knudsen M, Fivenson E, Croteau DL, Bohr VA. Cockayne syndrome: clinical features, model systems and pathways. Ageing Res Rev. 2017; 33:3–17. https://doi.org/10.1016/j.arr.2016.08.002 [PubMed]
- 25. Oshima J, Sidorova JM, Monnat RJ
Jr . Werner syndrome: clinical features, pathogenesis and potential therapeutic interventions. Ageing Res Rev. 2017; 33:105–14. https://doi.org/10.1016/j.arr.2016.03.002 [PubMed] - 26. Gonzalo S, Kreienkamp R, Askjaer P. Hutchinson-Gilford Progeria Syndrome: A premature aging disease caused by LMNA gene mutations. Ageing Res Rev. 2017; 33:18–29. https://doi.org/10.1016/j.arr.2016.06.007 [PubMed]
- 27. Giannakou ME, Partridge L. Role of insulin-like signalling in Drosophila lifespan. Trends Biochem Sci. 2007; 32:180–88. https://doi.org/10.1016/j.tibs.2007.02.007 [PubMed]
- 28. Guntur AR, Rosen CJ. IGF-1 regulation of key signaling pathways in bone. Bonekey Rep. 2013; 2:437. https://doi.org/10.1038/bonekey.2013.171 [PubMed]
- 29. Burtner CR, Kennedy BK. Progeria syndromes and ageing: what is the connection? Nat Rev Mol Cell Biol. 2010; 11:567–78. https://doi.org/10.1038/nrm2944 [PubMed]
- 30. Xing W, Govoni K, Donahue LR, Kesavan C, Wergedal J, Long C, Bassett JH, Gogakos A, Wojcicka A, Williams GR, Mohan S. Genetic Evidence that Thyroid Hormone is Indispensable for Prepubertal IGF-I Expression and Bone Acquisition in Mice. J Bone Miner Res. 2012; 27:1067–79. https://doi.org/10.1002/jbmr.1551 [PubMed]
- 31. Grøntved L, Waterfall JJ, Kim DW, Baek S, Sung MH, Zhao L, Park JW, Nielsen R, Walker RL, Zhu YJ, Meltzer PS, Hager GL, Cheng SY. Transcriptional activation by the thyroid hormone receptor through ligand-dependent receptor recruitment and chromatin remodelling. Nat Commun. 2015; 6:7048. https://doi.org/10.1038/ncomms8048 [PubMed]
- 32. Xu L, Glass CK, Rosenfeld MG. Coactivator and corepressor complexes in nuclear receptor function. Curr Opin Genet Dev. 1999; 9:140–47. https://doi.org/10.1016/S0959-437X(99)80021-5 [PubMed]
- 33. Visser WE, Bombardieri CR, Zevenbergen C, Barnhoorn S, Ottaviani A, van der Pluijm I, Brandt R, Kaptein E, van Heerebeek R, van Toor H, Garinis GA, Peeters RP, Medici M, et al. Tissue-Specific Suppression of Thyroid Hormone Signaling in Various Mouse Models of Aging. PLoS One. 2016; 11:e0149941. https://doi.org/10.1371/journal.pone.0149941 [PubMed]
- 34. Williams GR, Bassett JH. Thyroid diseases and bone health. J Endocrinol Invest. 2018; 41:99–109. https://doi.org/10.1007/s40618-017-0753-4 [PubMed]
- 35. Chatzinikolaou G, Apostolou Z, Aid-Pavlidis T, Ioannidou A, Karakasilioti I, Papadopoulos GL, Aivaliotis M, Tsekrekou M, Strouboulis J, Kosteas T, Garinis GA. ERCC1-XPF cooperates with CTCF and cohesin to facilitate the developmental silencing of imprinted genes. Nat Cell Biol. 2017; 19:421–32. https://doi.org/10.1038/ncb3499 [PubMed]
- 36. Bérubé NG, Mangelsdorf M, Jagla M, Vanderluit J, Garrick D, Gibbons RJ, Higgs DR, Slack RS, Picketts DJ. The chromatin-remodeling protein ATRX is critical for neuronal survival during corticogenesis. J Clin Invest. 2005; 115:258–67. https://doi.org/10.1172/JCI200522329 [PubMed]
- 37. Garrick D, Sharpe JA, Arkell R, Dobbie L, Smith AJ, Wood WG, Higgs DR, Gibbons RJ. Loss of Atrx affects trophoblast development and the pattern of X-inactivation in extraembryonic tissues. PLoS Genet. 2006; 2:e58. https://doi.org/10.1371/journal.pgen.0020058 [PubMed]
- 38. Hébert JM, McConnell SK. Targeting of cre to the Foxg1 (BF-1) locus mediates loxP recombination in the telencephalon and other developing head structures. Dev Biol. 2000; 222:296–306. https://doi.org/10.1006/dbio.2000.9732 [PubMed]
- 39. Bérubé NG, Jagla M, Smeenk C, De Repentigny Y, Kothary R, Picketts DJ. Neurodevelopmental defects resulting from ATRX overexpression in transgenic mice. Hum Mol Genet. 2002; 11:253–61. https://doi.org/10.1093/hmg/11.3.253 [PubMed]
- 40. Jiao Y, Killela PJ, Reitman ZJ, Rasheed AB, Heaphy CM, de Wilde RF, Rodriguez FJ, Rosemberg S, Oba-Shinjo SM, Nagahashi Marie SK, Bettegowda C, Agrawal N, Lipp E, et al. Frequent ATRX, CIC, FUBP1 and IDH1 mutations refine the classification of malignant gliomas. Oncotarget. 2012; 3:709–22. https://doi.org/10.18632/oncotarget.588 [PubMed]