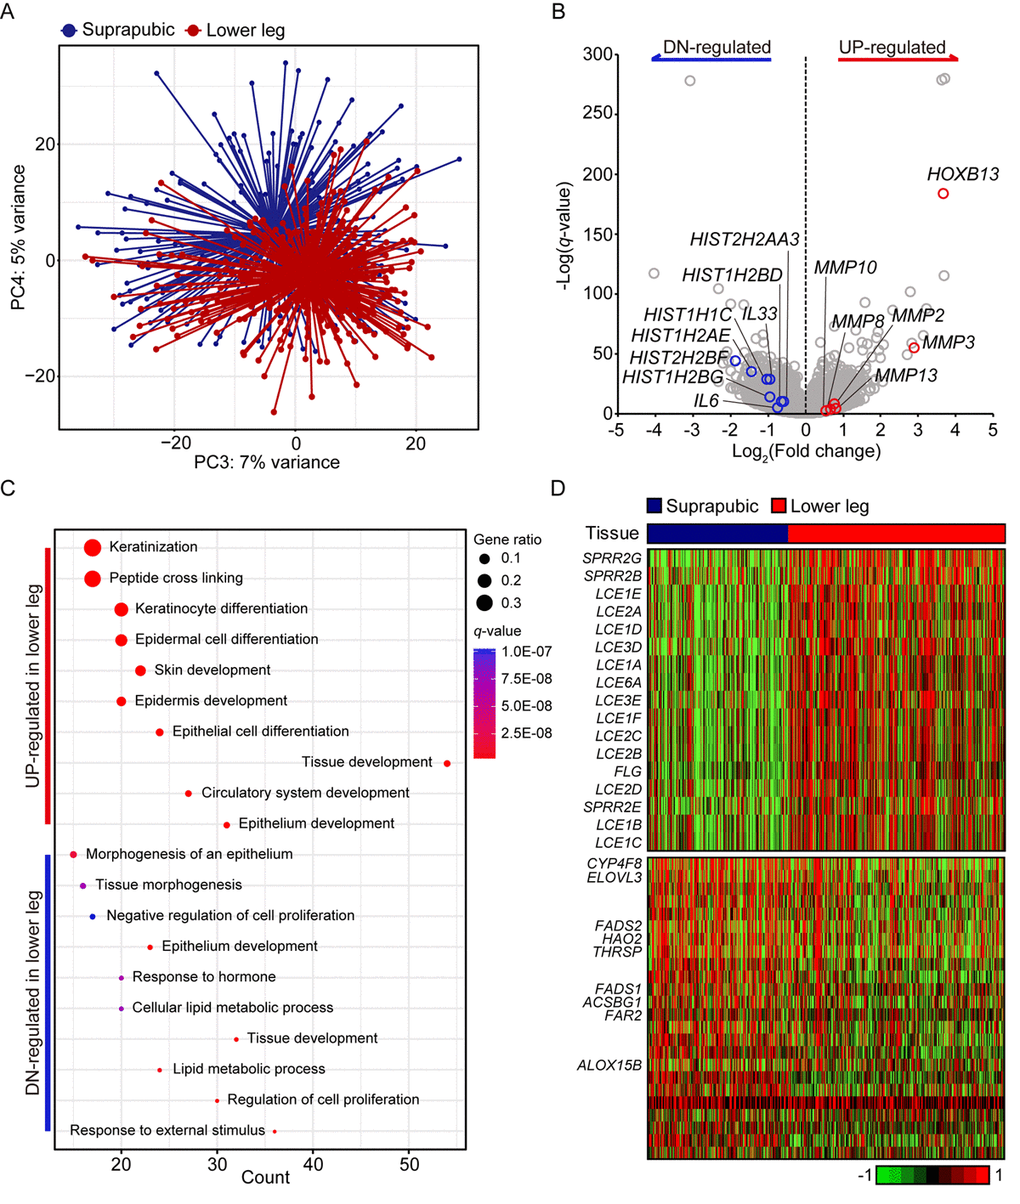
Figure 1.Transcriptome analysis of lower leg (UV exposed) and suprapubic (UV protected) skin samples. (A) Distinct separation of two groups was observed with principal component analysis. (B) Differentially expressed genes were displayed on the volcano plot. A few notable genes were marked. (C) Using differentially expressed genes, enriched pathways were shown in dot plot. Top 10 the most enriched pathways were used. Gene ratio = no. of genes that were enriched on the given pathway/ total no. of genes on the given gene set. q-value illustrated the significance. (D) Gene expression profiles of epidermal differentiation complex component genes (upper panel) and lipid metabolic process related genes (lower panel).