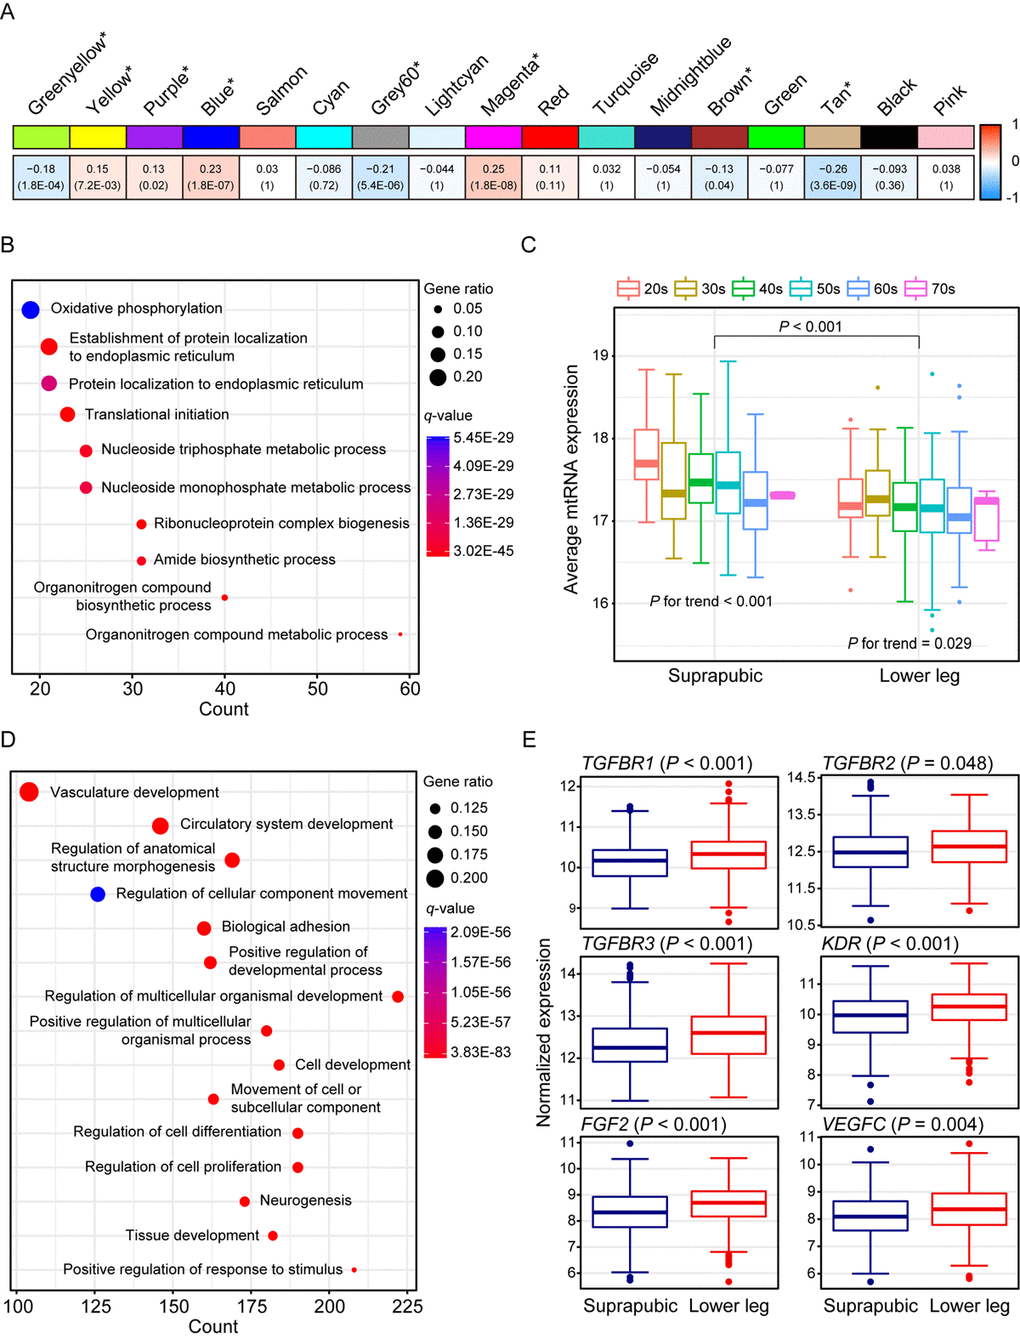
Figure 2.Weighted gene co-expression network analysis using all samples. (A) Module trait relationship of constructed modules. The statistically significant modules were marked with asterisk. The correlation values and Bonferroni-corrected P-values (in the bracket) were marked. (B) Pathway enrichment result for tan module. Top 10 the most enriched pathways were shown. (C) Estimated mitochondrial DNA copy number using mitochondrial RNA (mtRNA) expression level. Both tissues showed down-regulation of average mtRNA expression with aging (suprapubic: P for trend < 0.001 and lower leg: P for trend = 0.025). (D) Pathway enrichment result for blue module. Top 15 the most enriched pathways were used. (E) Relative gene expression levels of six angiogenesis related genes from blue module.