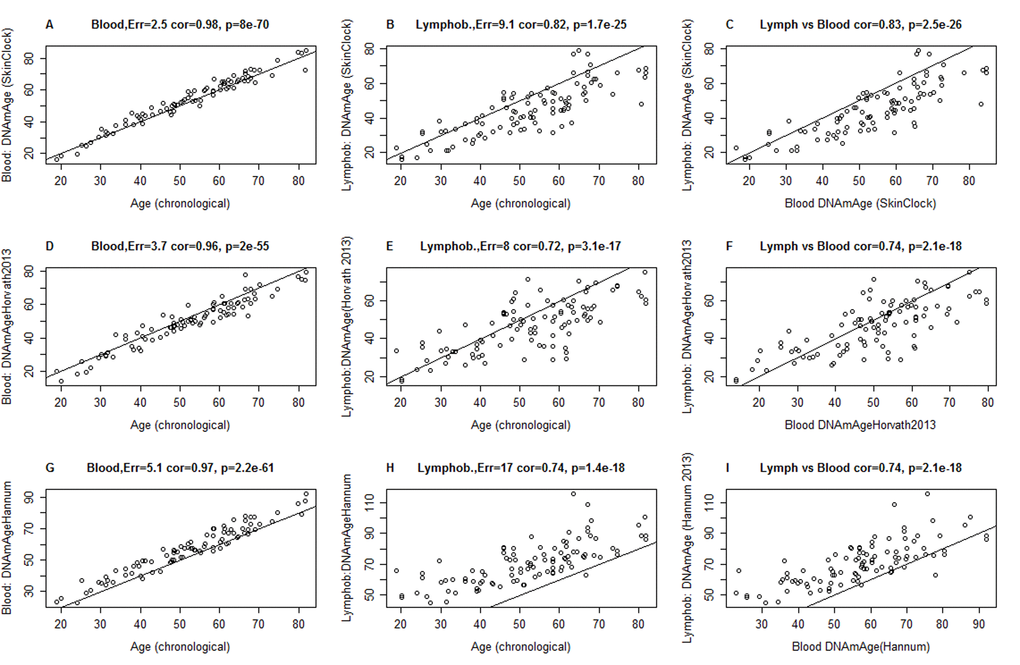
Figure 2.Comparison of DNAm age estimators in whole blood and lymphoblastoid cell line data. The rows correspond to 3 different age estimators: (A,B,C) the novel skin & blood clock (D,E,F), the pan-tissue clock (Horvath 2013) [6], (G,H,I) Hannum clock 9]. Panels in the first and second column report the accuracy in blood (A,D,C) and lymphoblastoid cell lines (B,E,H), respectively. Panels in the third column (C,F,I) report the relationship between DNAm age estimates in blood (x-axis) versus those in lymphoblastoid cell lines (y-axis). Panels report Pearson correlation coefficient and the estimation error, which is defined as median absolute deviation between the DNAm age estimate and chronological age. The lymphoblastoid cell lines were generated from the same individuals for whom whole blood was assessed, which facilitated the comparison in the third column.