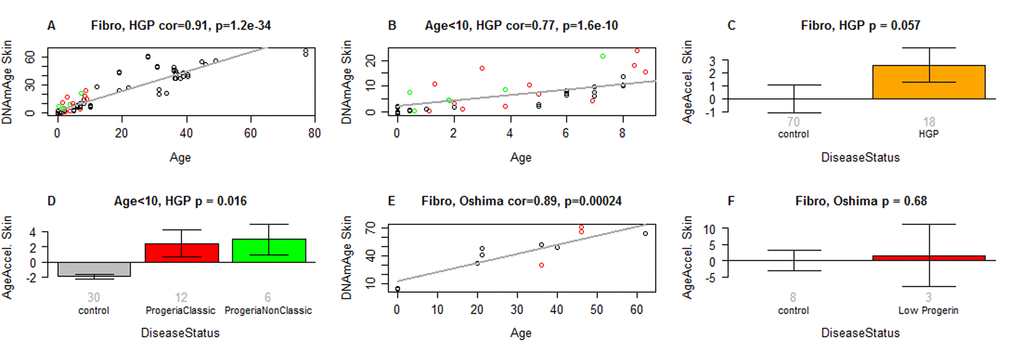
Figure 4.Skin & blood clock analysis of fibroblasts from HGP individuals of the Progeria Research Foundation. (A,B) The new skin & blood clock was used to estimate DNAm age (y-axis) in fibroblasts from HGP individuals and controls. (A) All individuals. (B) Children younger than 10 years old. Dots are colored by disease status: red=classical progeria, green=non-classical progeria, black=controls. The grey line corresponds to a regression line through control individuals. The epigenetic age acceleration effect for each individual (point) corresponds to the vertical distance to the black regression line. The fact that red and green points tend to lie above the grey line indicates that HGP cases exhibit suggestive accelerated epigenetic aging effect. (C) Mean epigenetic age acceleration (y-axis) versus HGP status. By definition, the mean age acceleration measure in controls is zero. (D) Epigenetic age acceleration (y-axis) versus disease status in individuals younger than 10. (E, F) report results for fibroblast samples from atypical Werner syndrome cases (low progerin) provided by co-author Junko Oshima. (E) DNAm age versus chronological age for atypical Werner syndrome samples (colored in red) and controls (colored in black). (F) Epigenetic age acceleration versus disease status. The title of the bar plots also reports a P-value from a nonparametric group comparison test (Kruskal Wallis test). Each bar plot reports the mean value and one standard error.