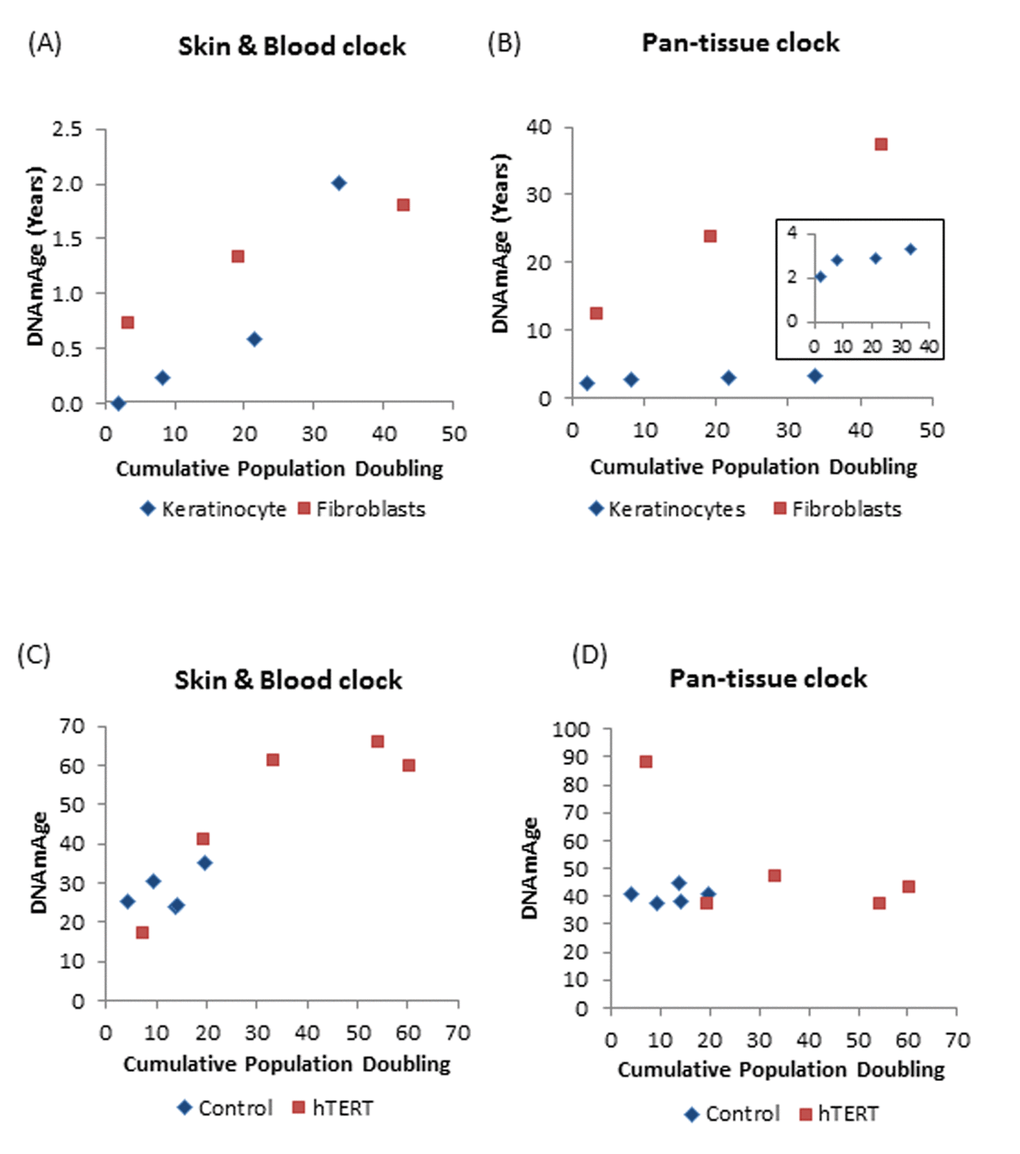
Figure 5.DNAm age versus population doubling levels. Each panel reports a DNAm age estimate (y-axis) versus cumulative population doubling level, respectively. Plots in the left and right panels correspond to the new skin & blood clock (A,C) and the pan-tissue clock (B,D) respectively. (A,B) Tracking of the epigenetic ages of neonatal fibroblasts (Red squares) and keratinocytes (Blue diamonds) in function of population doubling. Inset graph in (B) is a plot of ages of only the keratinocyte population (C,D). Epigenetic ages of human coronary artery endothelial cells derived from a 26 year old donor, in function of cumulative population doubling. Ages of uninfected control cells, which senesced after cumulative population doubling of 20, are shown in blue while those bearing hTERT, with extended proliferative capacity are in red. The blue dots with the highest cumulative doubling are at points when the cells reached replicative senescence. Cells with hTERT (represented by red squares) do not senesce and the last dots indicate the termination of the experiment.