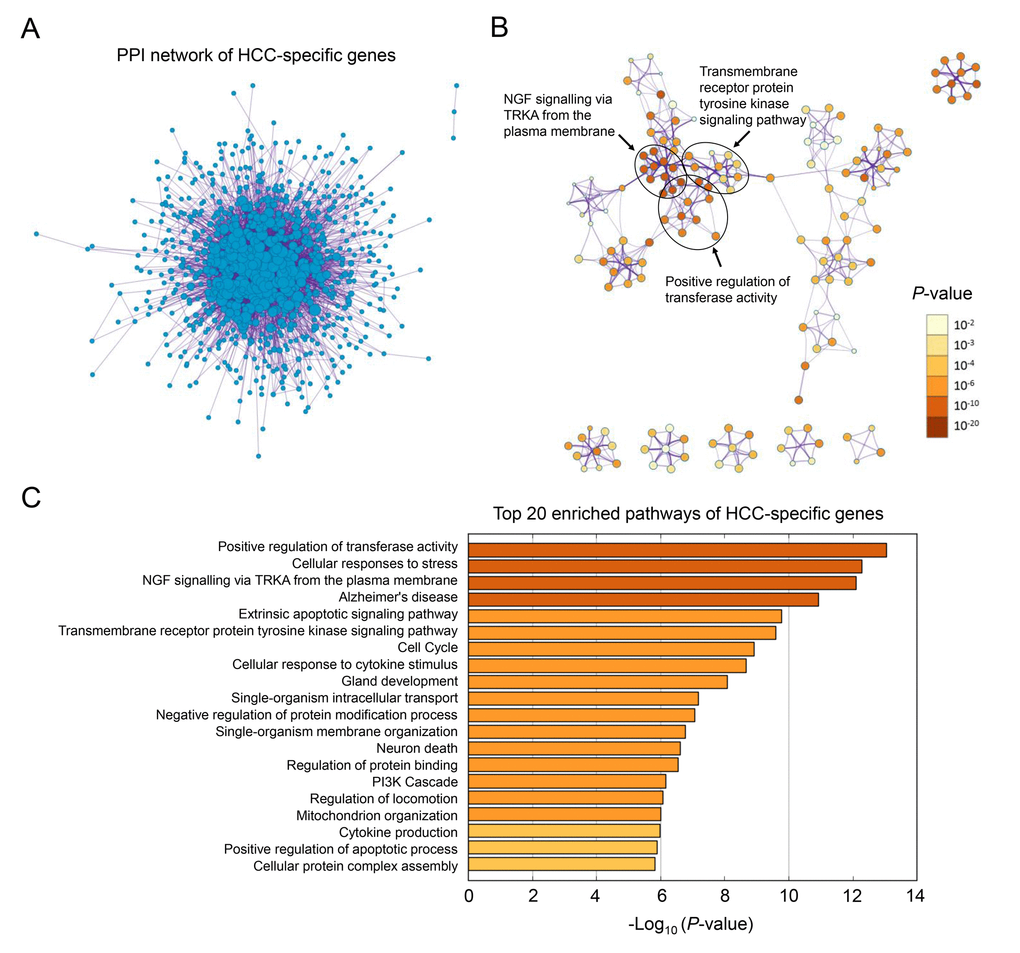
Figure 2.Gene ontology analysis of HCC-specific genes. (A) The PPI network of all the HCC-specific genes illustrated in Cytoscape. Each node represented a protein translated by an HCC-specific gene. (B) Network of 20 top-score modules (clusters) visualized in Cytoscape. Each cluster was made up of 10 best enriched GO terms within the threshold of Kappa-statistical similarity (0.3). Each node represented one enriched term and was colored by P value. In the figure, 3 representative pathways and the clusters they belonged to were marked. (C) The bar chart of 20 most enriched terms of HCC-specific genes arranged by -Log10P value.