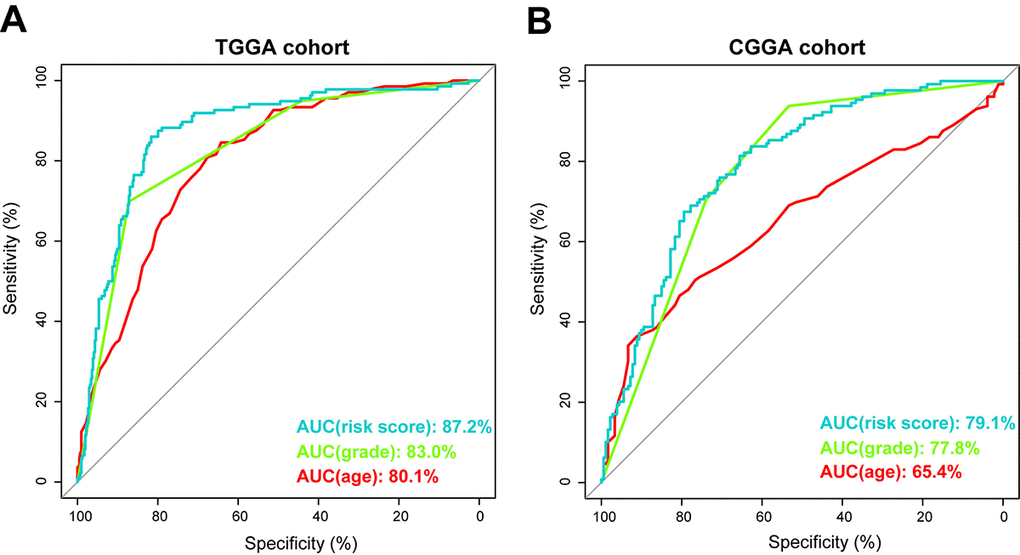
Figure 4.Prognostic power of the identified 29-gene signature in TCGA and CGGA cohorts. (A) ROC curve analysis of age, grade and risk score in TCGA cohort. (B) ROC curve analysis of age, grade and risk score in CGGA cohort. AUC, area under the curve.