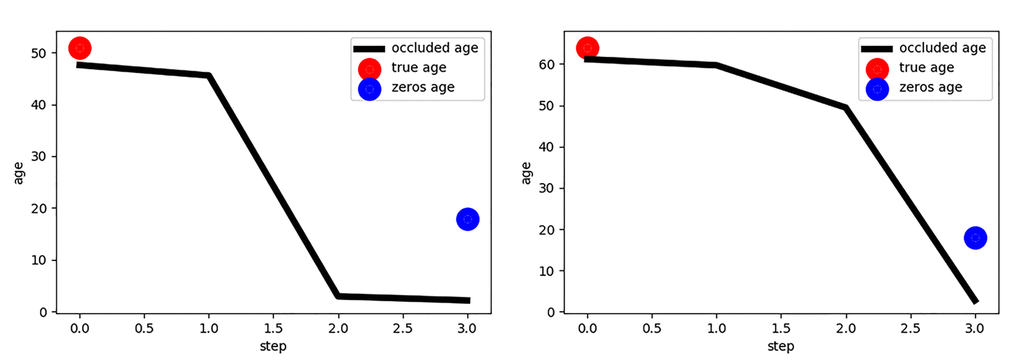
Figure 3.Estimated age vs. the occlusion step for two persons. The first plot represents the results for the younger-aged person (50 years). The second plot represents the results for the older-aged person (62 years). Blue points correspond to the age produced by zeros tensor. This age reflects the initial step of age estimation by neural network model when it was fed an all-black image. This happened because of learned biases parameters.