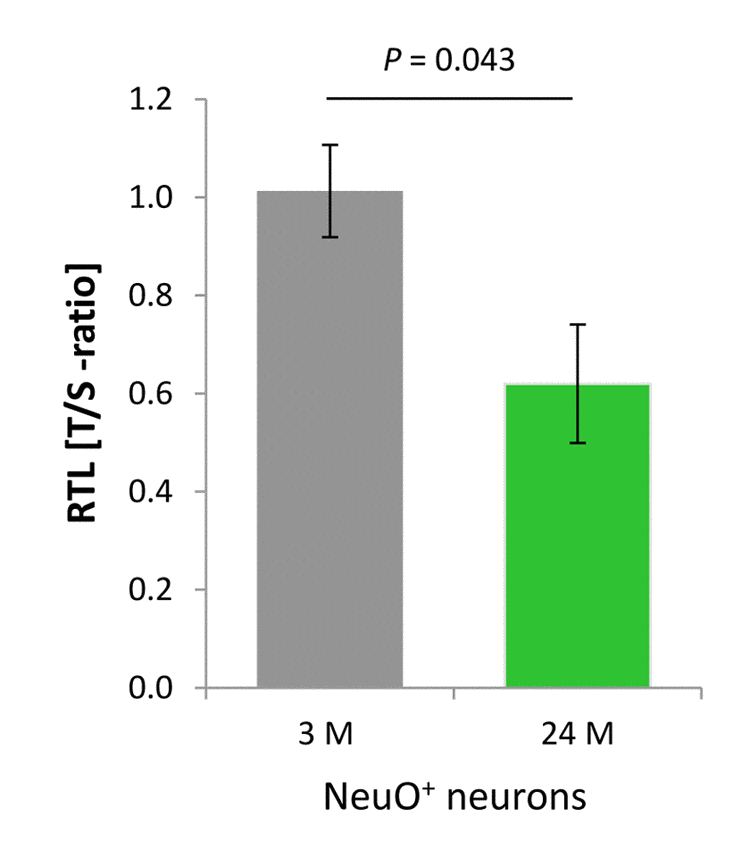
Figure 5.Age-dependent telomere length dynamics in the neuronal fraction sorted from murine cortical isolates. NeuO+ neurons showed a significant age-related decline in RTL as determined by qPCR in terms of telomere repeat (T) to single copy gene (S) ratio. Bars represent means ± SEM (n = 4). P-values were calculated using Student’s t-test.