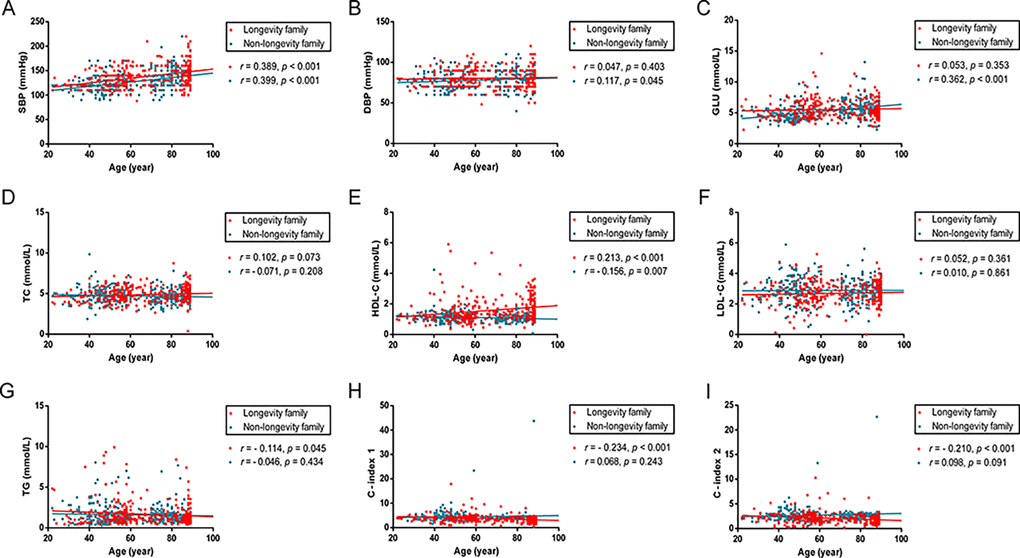
Figure 1.Scatter plots and linear fit line of participants’ age versus SBP, DBP, Glucose and plasma lipid profiles. Participants spanned 20 - 89 years of age. Each dot represents an individual in longevity family (red) and non-longevity family (blue). (A) SBP levels are positively correlated with age both in longevity and non-longevity families. (B, C) DBP and GLU levels are positively correlated with age in non-longevity family, but no statistically significant difference in longevity family. (D, F) TC and LDL levels are not statistically significantly correlated with age in both families. (E) HDL levels are positively correlated with age in longevity family and negatively correlated with age in non-longevity family. (G, H, I) TG, C – index 1 and C – index 2 levels are negatively correlated with age in longevity family, but no statistically significant difference in non-longevity family. Correlation coefficient (r) and P-value were acquired by Pearson correlation test. For these analyses, 18 participants carrying the ε2/ε4 isoform were excluded. Abbreviations: SBP, systolic blood pressure; DBP, diastolic blood pressure; GLU, glucose; TC, total cholesterol; HDL, high-density lipoproteins; LDL, low-density lipoproteins; TG, triglycerides; C-index 1, castelli’s index 1; C-index 2, castelli’s index 2.