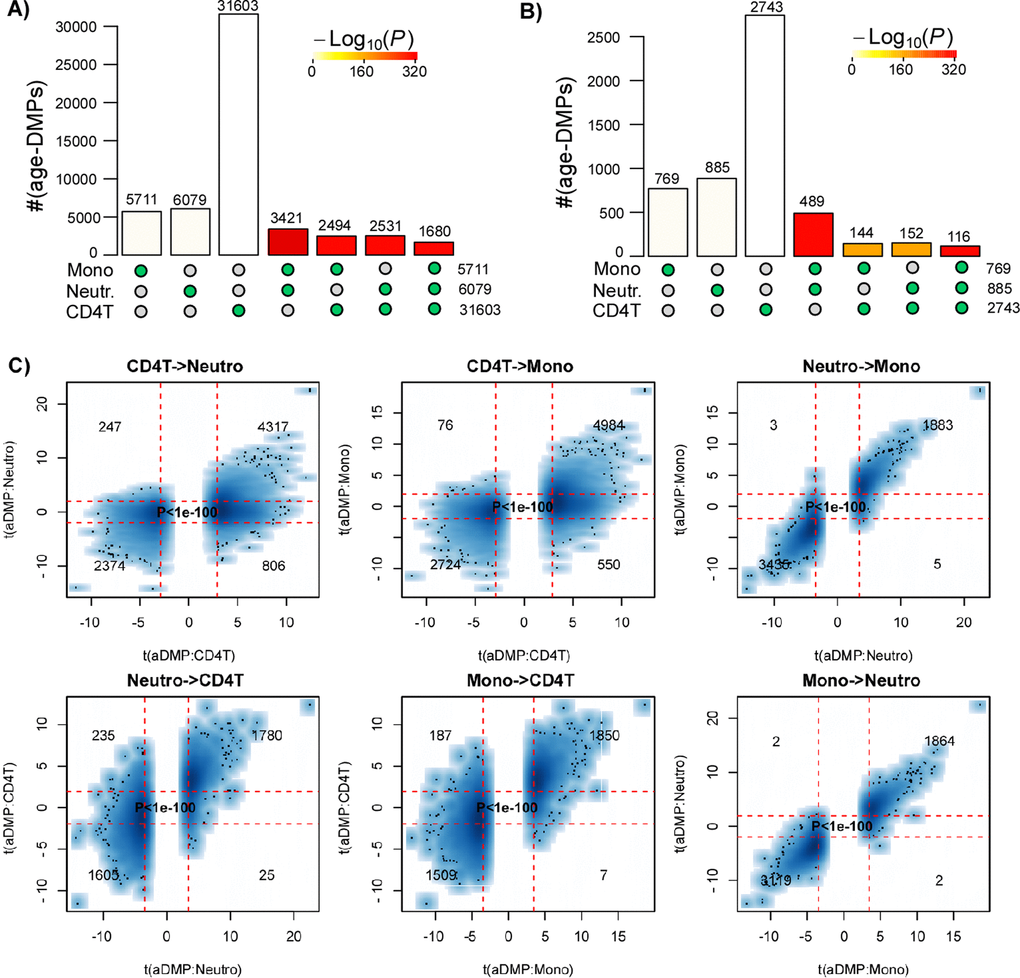
Figure 2.Most age-DMPs are shared between blood cell subtypes: validation in BLUEPRINT. (A) Landscape overlap diagram for age-DMPs defined using FDR<0.05 threshold in the matched multi cell-types DNAm dataset from BLUEPRINT (139 monocyte samples, 139 matched CD4+ T-cell samples and 139 matched neutrophil samples. Barplots indicate the number of aDMPs found in each purified cell-type, or the corresponding aDMP overlap between cell-types. For the overlapping categories, the P-value of the overlap is indicated by the color of the bar, as shown. (B) As (A), but now using a Bonferroni corrected P<0.05 threshold. (C) Smoothed scatterplots of t-statistics of age-DMPs called in a given blood cell subtype vs. the corresponding t-statistics in another cell subtype, as indicated for the 3 pairwise comparisons. In each panel, we only depict the 100 most outlier data points, provide the number of probes in each significant quadrant and the P-value assessing agreement is from a one-tailed Fisher-test. The vertical red lines indicate the line of FDR<0.05, whilst the horizontal lines depict the “validation threshold” of P<0.05.