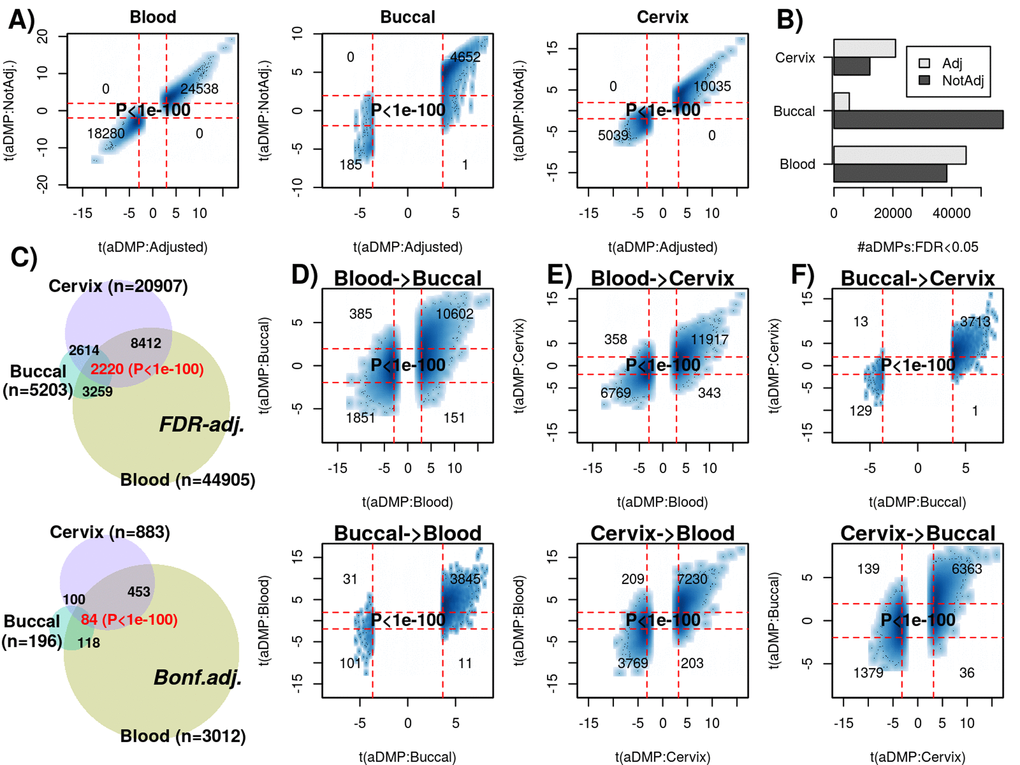
Figure 3.Most age-DMPs are shared between tissue-types. (A) Smoothed scatterplots of age-DMP (aDMP) t-statistics obtained after adjustment for cell-type heterogeneity (x-axis) against the corresponding t-statistics without adjustment (y-axis), for 3 different tissue-types (Blood, Buccal and Cervix) separately. In each scatterplot, we only depict the 100 most outlier data points, provide the number of probes in each significant quadrant and the P-value is from a one-tailed Fisher-test. The vertical red lines indicate the line of FDR<0.05, whilst the horizontal lines depict the “validation threshold” of P<0.05. (B) Barplot of the number of aDMPs (FDR<0.05) in each tissue-type before and after adjustment for cell-type heterogeneity. (C) Venn-diagrams representing the number of overlapping aDMPs between the 3 tissue-types using an FDR<0.05 threshold for calling aDMPs (top panel) and using a Bonferroni threshold (lower panel). P-value as estimated using a nested Hypergeometric test. (D) Smoothed scatterplots of aDMP t-statistics (adjusted for cell-type heterogeneity) in blood (x-axis) against their corresponding t-statistics in buccal (y-axis) for top panel, with lower panel depicting the reverse analysis, as indicated. (E-F) As (D), but for the combinations blood-cervix and buccal-cervix, respectively.