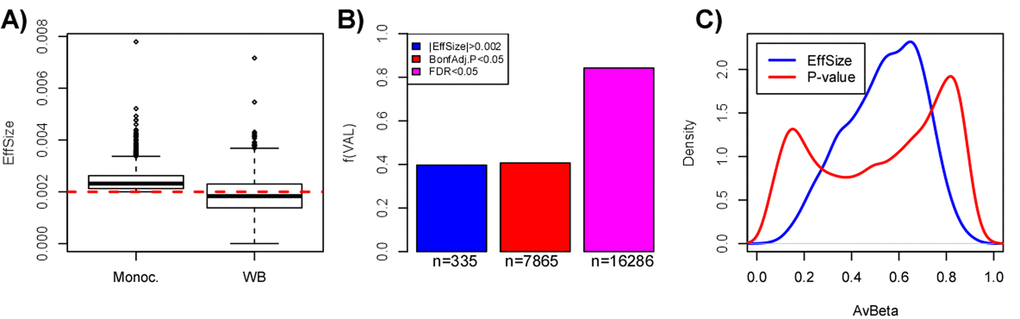
Figure 5.Pitfalls of using a threshold on effect-size only to select aDMPs. (A) Boxplots comparing the effect size distribution for the 844 aDMPs defined in the Reynolds monocyte set against their effect sizes in the whole blood dataset from Hannum et al. (B) Barplots comparing the fraction of aDMPs, defined either by the effect size threshold (blue) or P-value threshold (red & magenta, Bonferroni-adjusted), that validate in the whole blood set from Hannum et al. In Hannum et al, validated aDMPs were defined either as those passing the same effect size threshold (blue), or the same Bonferroni-threshold (red), or a more relaxed FDR<0.05 threshold (magenta). The numbers below the bars indicate the absolute number of aDMPs validating in Hannum et al. This panel demonstrates that using the same effect size threshold to define aDMPs in a dataset of complex tissue samples could miss up to 40% of true aDMPs. (C) Comparison of the density profiles of the average DNAm for the 844 aDMPs defined by having an effect size larger (in absolute magnitude) than 0.002 (equivalent to a 2% DNAm change over 10 years) (blue line) across the 1199 monocyte samples of Reynolds et al, versus the corresponding density profile of the 18596 gold-standard aDMPs with Bonferroni adjusted P-values < 0.05.