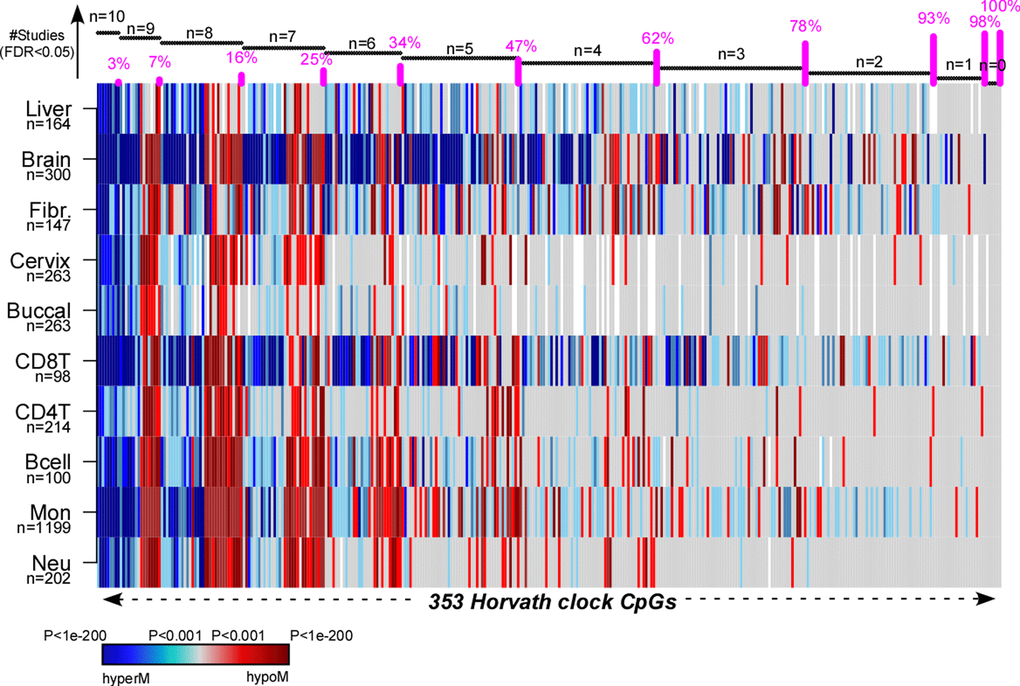
Figure 6.Pan-tissue analysis of Horvath’s clock CpGs. Heatmap displays the signed P-values of the 353 Horvath Clock CpGs across 10 independent cell or tissue-types, where the P-values derive from a linear model of DNAm against age plus additional confounders as covariates. Blue denotes highly significantly age-associated hypermethylation (hyperM), red denotes highly significant hypomethylation (hypoM). The 353 clock CpGs have been ranked according to the number of cell/tissue types where they are age-DMPs (using FDR<0.05), indicated by horizontal black bars at top. The cumulative proportion of the 353 CpGs that are age-DMPs in 10, 9, 8, 7, 6, 5, 4, 3, 2 or 1 studies are shown as vertical bars.