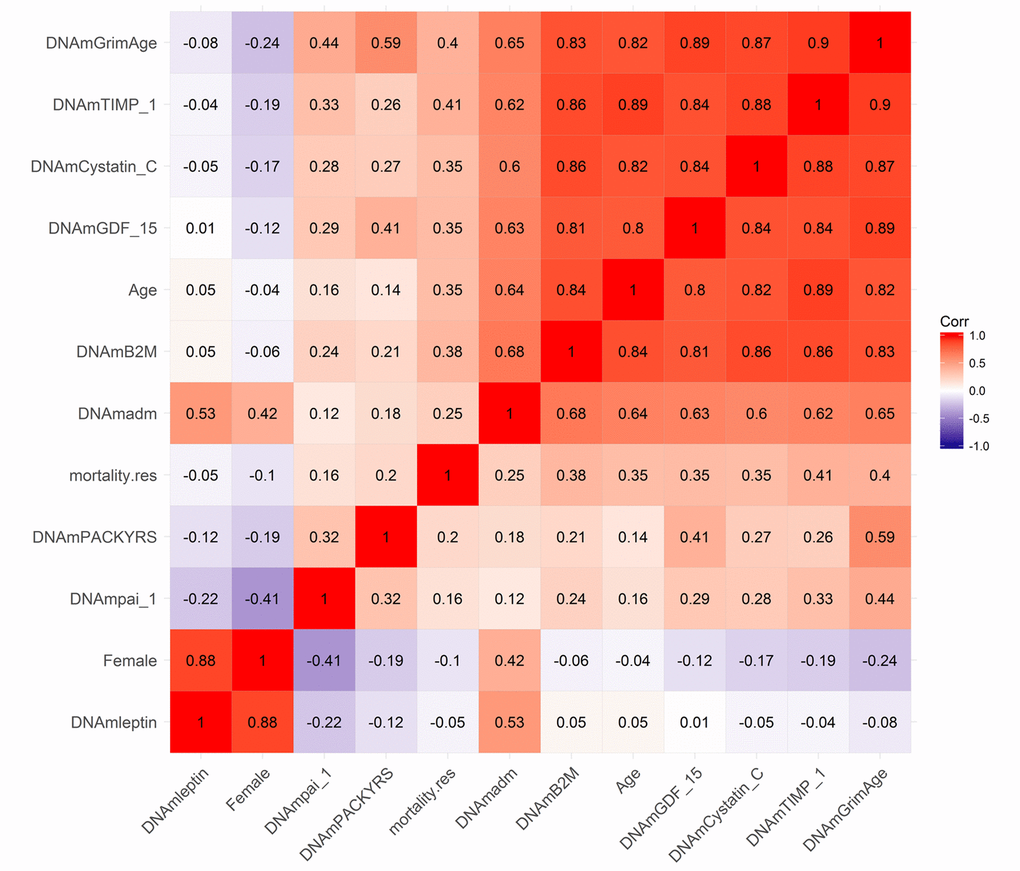
Figure 2.Heat map of pairwise correlations of DNAm based biomarkers. The heat map color-codes the pairwise Pearson correlations of select variables (surrounding the definition of DNAm GrimAge) in the test data from the Framingham Heart Study (N=625). DNAm GrimAge is defined as a linear combination of chronological age (Age), sex (Female takes on the value 1 for females and 0 otherwise), and eight DNAm-based surrogate markers for smoking pack-years (DNAm PACKYRS), adrenomedullin levels (DNAm ADM), beta-2 microglobulin (DNAm B2M), cystatin C (DNAm Cystatin C), growth differentiation factor 15 (DNAm GDF-15), leptin (DNAm Leptin), plasminogen activation inhibitor 1 (DNAm PAI-1), issue inhibitor metalloproteinase 1 (DNAm TIMP-1). The figure also includes an estimator of mortality risk, mortality.res, which can be interpreted as a measure of "excess" mortality risk compared to the baseline risk in the test data. Formally, mortality.res is defined as the deviance residual from a Cox regression model for time-to-death due to all-cause mortality. The rows and columns of the Figure are sorted according to a hierarchical clustering tree. The shades of color (blue, white, and red) visualize correlation values from -1 to 1. Each square reports a Pearson correlation coefficient.